
November 10, 2025 a 03:15 pm

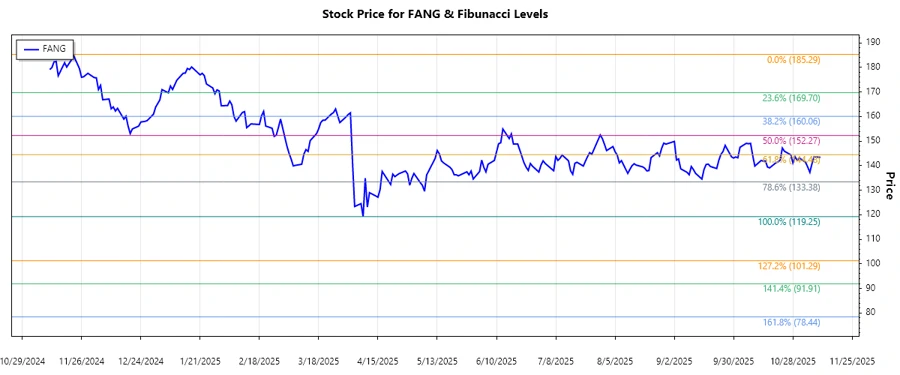
FANG: Fibonacci Analysis - Diamondback Energy, Inc.
Diamondback Energy, Inc. (Ticker: FANG) continues to demonstrate resilience in the volatile oil and natural gas market, focusing on strategic operations in the Permian Basin. The company's robust positioning in unconventional reserves offers potential for profitable growth, yet industry fluctuations pose inherent risks. Investors should stay vigilant of market dynamics and operational efficiency for future gains.
Fibonacci Analysis
| Description | Details |
|---|---|
| Trend Period | 2024-11-11 to 2025-11-10 |
| High Price & Date | $185.29 on 2024-11-22 |
| Low Price & Date | $119.25 on 2025-04-08 |
| Fibonacci Level | Price Level |
|---|---|
| 0.236 | $133.92 |
| 0.382 | $143.29 |
| 0.5 | $152.27 |
| 0.618 | $161.25 |
| 0.786 | $173.54 |
Current Price: $143.39 is in the 0.382 Fibonacci retracement level.
Technical Interpretation: The current position at the 0.382 level may indicate a potential support zone, providing a possibility of price stabilization before resuming an upward trend or further correction.
Conclusion
Diamondback Energy, Inc.'s stock displays a recent recovery from its March lows, signifying potential resilience. The mid-level retracement zone at 0.382 of the Fibonacci scale suggests a potential stabilization point amidst market fluctuations. While the company capitalizes on its strategic assets in the Permian Basin, broader market conditions such as oil price volatility and geopolitical tensions remain crucial variables. The stock's progression within the retracement ranges may offer technical traders insights into potential momentum shifts. Cautious optimism is advisable, as continued economic indicators and operational results will likely play pivotal roles in future valuation adjustments.
Smart Data Insight
Master the Perfect Entry & Exit for this Stock
Don't leave your profits to chance. Historically, this stock follows specific seasonal patterns that institutional traders use to maximize returns.
- ✅ Identify the "Golden Buying Window"
- ✅ Avoid high-risk correction cycles
- ✅ Backtested data from the last 20+ years