September 23, 2025 a 03:15 pm
FANG: Fibonacci Analysis - Diamondback Energy, Inc.
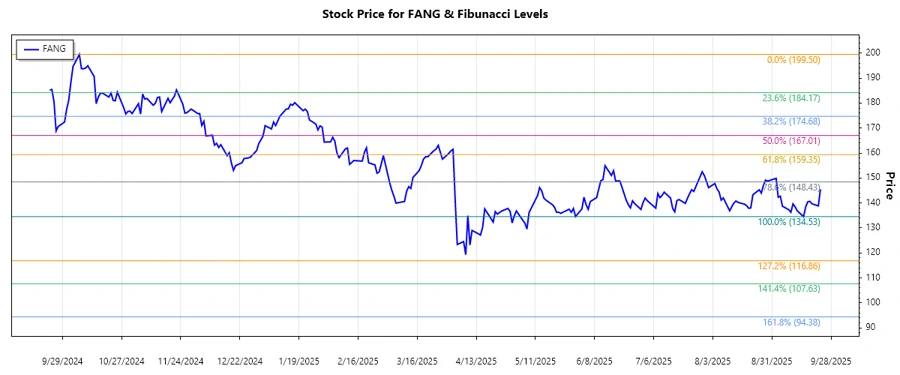
Diamondback Energy, Inc., operating in the Permian Basin, has shown resilience amidst fluctuating oil prices. While the company has faced headwinds due to market volatility, recent data indicate signs of stabilization. The current stock trend may offer potential opportunities for investors seeking exposure in the oil sector.
Fibonacci Analysis
| Trend Analysis | Details |
|---|---|
| Start Date | 2024-10-07 |
| End Date | 2025-09-23 |
| High Price | $199.50 (2024-10-07) |
| Low Price | $134.53 (2025-09-15) |
| Fibonacci Level | Price Level |
|---|---|
| 0.236 | $148.37 |
| 0.382 | $160.82 |
| 0.5 | $167.02 |
| 0.618 | $173.23 |
| 0.786 | $182.02 |
Current price level at $145.47 sits in the none retracement zone.
Technically, the stock may face resistance at higher retracement levels, especially near the 0.382 and 0.5 Fibonacci levels, indicating possible consolidation before further directional moves.
Conclusion
The analysis of Diamondback Energy, Inc.'s stock reveals an overarching downtrend over the assessed period, posing potential risks for short-term growth. Despite recent price stability, broad market conditions and oil price fluctuations remain key uncertainties. However, the company's strong operational presence in the Permian Basin offers long-term prospects. Investors should weigh current price levels against potential market corrections, while also considering broader economic indicators. Understanding these dynamics can provide valuable insights for informed investment decisions in a volatile sector.
Smart Data Insight
Master the Perfect Entry & Exit for this Stock
Don't leave your profits to chance. Historically, this stock follows specific seasonal patterns that institutional traders use to maximize returns.
- ✅ Identify the "Golden Buying Window"
- ✅ Avoid high-risk correction cycles
- ✅ Backtested data from the last 20+ years