January 26, 2026 a 07:31 am
FANG: Dividend Analysis - Diamondback Energy, Inc.
Diamondback Energy, Inc. presents a complex yet intriguing dividend profile. While the company offers a stable dividend history with an 8-year streak, recent indicators of a potential suspension in 2025 suggest a need for cautious optimism. The dividend yield of 2.77% sits comfortably within industry standards, yet attention must be paid to the concerning payout ratios, particularly the high free cash flow-based payout ratio. This analysis explores these elements to guide investors in understanding the long-term dividend sustainability and profitability of Diamondback Energy.
📊 Overview
Diamondback Energy operates within the energy sector, offering a current dividend yield of 2.77%. Its dividend history spans 8 years, showcasing a reliable payout rhythm, although it last faced a cut or suspension in 2025, challenging its continuity amidst fluctuating market conditions.
| Metric | Value |
|---|---|
| Sector | Energy |
| Dividend Yield | 2.77% |
| Current Dividend Per Share | 7.39 USD |
| Dividend History | 8 years |
| Last Cut or Suspension | 2025 |
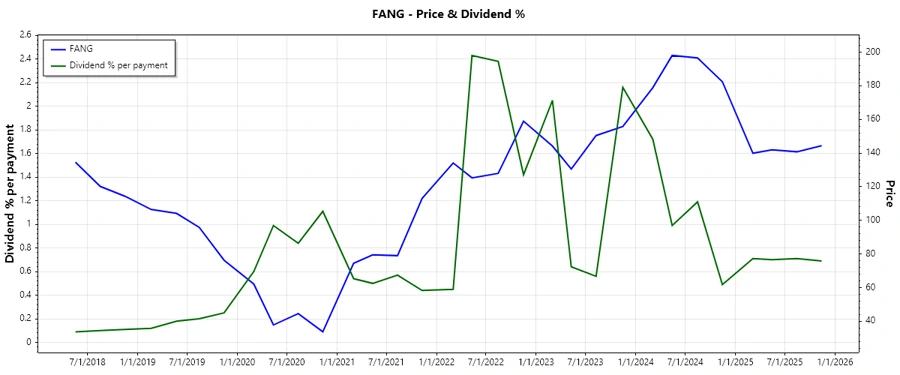
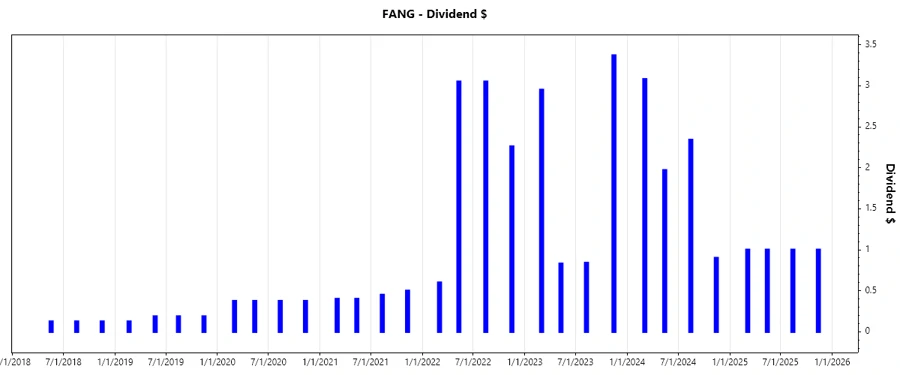
🗣️ Dividend History
Analyzing the dividend history is vital in assessing a company's commitment to returning value to shareholders. Consistency in dividend payments reflects on a firm's cash flow robustness and earnings predictability. However, recent trends, including a cut or suspension, can signal shifts in corporate strategy or market conditions.
| Year | Dividend Per Share (USD) |
|---|---|
| 2025 | 4.00 |
| 2024 | 8.29 |
| 2023 | 7.99 |
| 2022 | 8.96 |
| 2021 | 1.75 |
📈 Dividend Growth
Dividend growth is a crucial measure of a company's financial health and sustainability. It indicates the potential for future income increase for shareholders. However, Diamondback has reported a marginal negative growth over the 3-year interval and a moderate steady growth over 5 years, suggesting mixed long-term prospects.
| Time | Growth |
|---|---|
| 3 years | -0.24% |
| 5 years | 0.22% |
The average dividend growth is 0.22% over 5 years. This shows moderate but steady dividend growth.
📉 Payout Ratio
The payout ratio is a critical indicator of dividend sustainability. A high payout ratio means less reinvestment into growth opportunities. While Diamondback's EPS payout ratio is reasonable at 51.1%, the remarkably high 484% free cash flow-based payout ratio signals potential cash flow constraints that need a review of dividend policies.
| Key figure | Ratio |
|---|---|
| EPS-based | 51.10% |
| Free cash flow-based | 484% |
The EPS-based payout ratio of 51.10% is sustainable yet concerning compared to the exceedingly high FCF-based payout of 484%, which indicates potential liquidity pressure.
✅ Cashflow & Capital Efficiency
Understanding the efficiency of capital allocation and cash flow generation is pertinent in evaluating Diamondback's operational efficiency. The metrics reflect on the company's ability to generate cash and invest strategically, impacting stakeholder returns.
| Metric | 2024 | 2023 | 2022 |
|---|---|---|---|
| Free Cash Flow Yield | -15.36% | 4.32% | 11.23% |
| Earnings Yield | 9.54% | 11.26% | 18.16% |
| CAPEX to Operating Cash Flow | 183.8% | 79.63% | 57.12% |
| Stock-based Compensation to Revenue | 0.59% | 0.65% | 0.57% |
| Free Cash Flow / Operating Cash Flow Ratio | -83.80% | 20.37% | 42.88% |
The cash flow and capital allocation metrics illustrate a company with fluctuating cash flow yields. The high CAPEX to cash flow ratio in 2024 raises concerns about capital efficiency and future cash sufficiency.
⚠️ Balance Sheet & Leverage Analysis
Analyzing the balance sheet and leverage shows the financial robustness and solvency of Diamondback. The company's debt metrics are indicative of its borrowings strategy and long-term financial commitments.
| Metric | 2024 | 2023 | 2022 |
|---|---|---|---|
| Debt-to-Equity | 0.33 | 0.41 | 0.43 |
| Debt-to-Assets | 0.18 | 0.23 | 0.24 |
| Debt-to-Capital | 0.25 | 0.29 | 0.30 |
| Net Debt to EBITDA | 1.49 | 1.01 | 0.86 |
| Current Ratio | 0.62 | 0.77 | 0.81 |
| Quick Ratio | 0.41 | 0.74 | 0.77 |
| Financial Leverage | 1.78 | 1.74 | 1.75 |
The slight increases in leverage ratios warrant a focus on control measures to manage the debt load effectively over the coming years.
📈 Fundamental Strength & Profitability
The profitability measures offer insight into the company’s ability to generate profit per shareholder equity, assets and more. Margins reveal how well a company converts sales into earnings.
| Metric | 2024 | 2023 | 2022 |
|---|---|---|---|
| Return on Equity | 8.85% | 18.91% | 29.22% |
| Return on Assets | 4.96% | 10.84% | 16.73% |
| Net Margin | 30.28% | 37.69% | 45.85% |
| EBIT Margin | 43.45% | 53.04% | 61.51% |
| EBITDA Margin | 69.30% | 73.98% | 75.56% |
| Gross Margin | 45.11% | 57.54% | 70.05% |
| Research & Development to Revenue | 0% | 0% | 0% |
Diamondback's profitability metrics highlight a robust margin structure, but the recent dip in ROE over 2024 needs strategic growth initiatives.
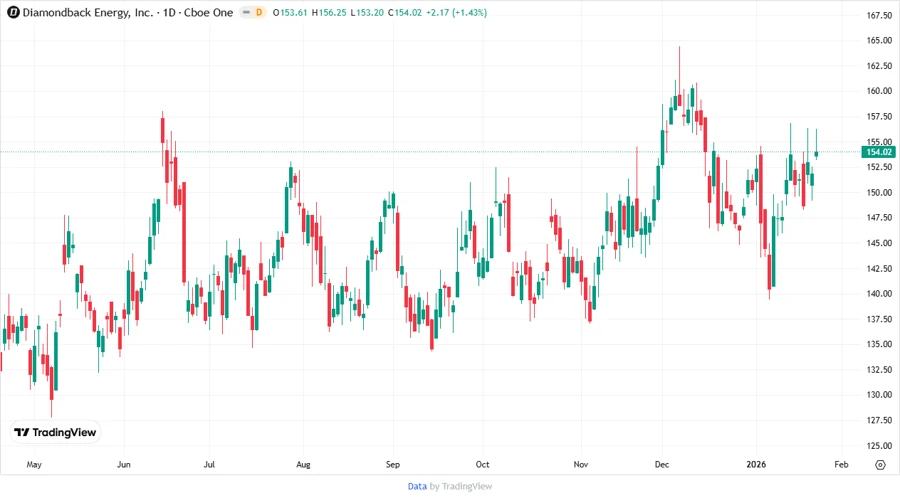
💹 Price Development
🤝 Dividend Scoring System
An individualized scoring system evaluating critical dividend features:
| Criteria | Score | Score Bar |
|---|---|---|
| Dividend Yield | 3.5 | |
| Dividend Stability | 3 | |
| Dividend Growth | 2.5 | |
| Payout Ratio | 3 | |
| Financial Stability | 4 | |
| Dividend Continuity | 2 | |
| Cashflow Coverage | 2 | |
| Balance Sheet Quality | 4 |
Overall Score: 24/40
💬 Rating
The dividend profile of Diamondback Energy, Inc. requires careful consideration. While the yield and stability present current strengths, potential future risks like high payout ratios and recent dividend cuts weigh heavily. Investors should monitor the company's strategic adjustments and market conditions to gauge the sustainability of dividends. Balancing these factors, investors are advised to approach with moderated expectations and consideration of broader diversification strategies.