January 08, 2026 a 12:46 pm

FANG: Dividend Analysis - Diamondback Energy, Inc.
Diamondback Energy, Inc., a prominent player in the energy sector, offers a unique dividend profile that presents both opportunities and challenges. With a dividend yield of 2.77% and a history of eight consecutive years of payouts, the company demonstrates robust financial commitment to its shareholders. However, the recent suspension in 2025 warrants prudent scrutiny. This analysis delves into various aspects of the company's dividend strategy and financial health.
📊 Overview
The overview provides insights into Diamondback Energy's sector position and its dividend payout commitments over the years.
| Key Metric | Value |
|---|---|
| Sector | Energy |
| Dividend yield | 2.77% |
| Current dividend per share | 7.39 USD |
| Dividend history | 8 years |
| Last cut or suspension | 2025 |
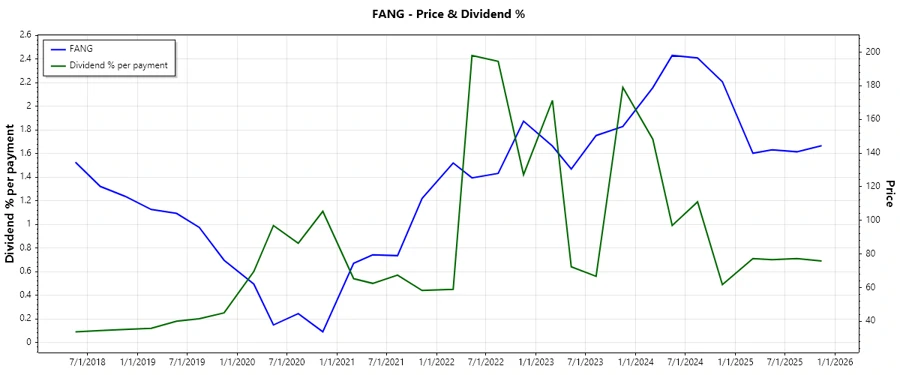
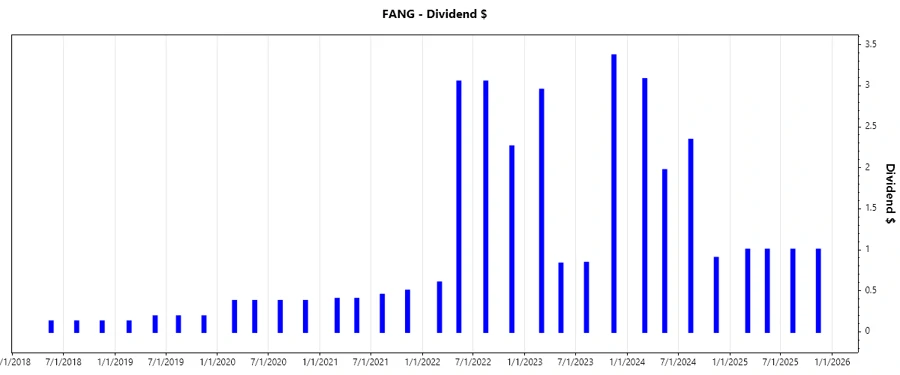
🗣️ Dividend History
Understanding the dividend history allows us to analyze the company's consistency in rewarding its shareholders. This metric often reflects a company's stability and financial performance over time.
| Year | Dividend Per Share (USD) |
|---|---|
| 2025 | 4.00 |
| 2024 | 8.29 |
| 2023 | 7.99 |
| 2022 | 8.96 |
| 2021 | 1.75 |
📈 Dividend Growth
Examining the dividend growth provides insights into the pace at which a company increases its payouts. A growing dividend often signals strong future earnings potential.
| Time | Growth |
|---|---|
| 3 years | -0.24% |
| 5 years | 21.67% |
The average dividend growth is 21.67% over 5 years. This shows moderate but steady dividend growth.
📉 Payout Ratio
The payout ratio reflects the proportion of earnings a company pays to its shareholders as dividends. Understanding this helps assess the sustainability of such payouts.
| Key Figure | Ratio |
|---|---|
| EPS-based | 51.10% |
| Free cash flow-based | 486.08% |
The EPS-based payout ratio of 51.10% is reasonable, suggesting dividends are well-covered by earnings. In contrast, the FCF payout ratio of 486.08% may indicate that dividends exceed cash flow from operations.
✅ Cashflow & Capital Efficiency
A company's cash flow and capital efficiency are crucial for evaluating its operational efficiency and capacity to fund growth and dividends.
| Metric | 2024 | 2023 | 2022 |
|---|---|---|---|
| Free Cash Flow Yield | -15.36% | 4.32% | 11.23% |
| Earnings Yield | 9.54% | 11.26% | 18.16% |
| CAPEX to Operating Cash Flow | 183.80% | 79.63% | 57.12% |
| Stock-based Compensation to Revenue | 0.59% | 0.65% | 0.57% |
| Free Cash Flow / Operating Cash Flow Ratio | -83.80% | 20.37% | 42.88% |
These metrics suggest volatility in cash flow management, particularly in the latest fiscal year, indicating room for improvement in capital efficiency practices.
⚠️ Balance Sheet & Leverage Analysis
A thorough understanding of leverage and balance sheet health is vital for assessing Diamondback Energy's financial endurance and risk profile.
| Metric | 2024 | 2023 | 2022 |
|---|---|---|---|
| Debt-to-Equity | 0.33 | 0.41 | 0.43 |
| Debt-to-Assets | 0.18 | 0.23 | 0.24 |
| Debt-to-Capital | 0.25 | 0.29 | 0.30 |
| Net Debt to EBITDA | 1.49 | 1.01 | 0.86 |
| Current Ratio | 0.44 | 0.77 | 0.81 |
| Quick Ratio | 0.41 | 0.74 | 0.77 |
| Financial Leverage | 1.78 | 1.74 | 1.75 |
Diamondback Energy's balance sheet shows moderate leverage with relatively stable debt ratios, demonstrating reasonable financial stability.
🔍 Fundamental Strength & Profitability
Assessing profitability metrics provides a window into Diamondback Energy's operational effectiveness and potential for future earnings growth.
| Metric | 2024 | 2023 | 2022 |
|---|---|---|---|
| Return on Equity | 8.85% | 18.91% | 29.22% |
| Return on Assets | 4.96% | 10.84% | 16.73% |
| Net Margin | 30.28% | 37.69% | 45.85% |
| EBIT Margin | 43.45% | 53.04% | 61.51% |
| EBITDA Margin | 69.30% | 73.98% | 75.56% |
| Gross Margin | 45.11% | 57.54% | 70.05% |
| Research & Development to Revenue | 0% | 0% | 0% |
The fundamental metrics indicate strong profitability, with high returns on equity and assets, underpinned by solid margins.
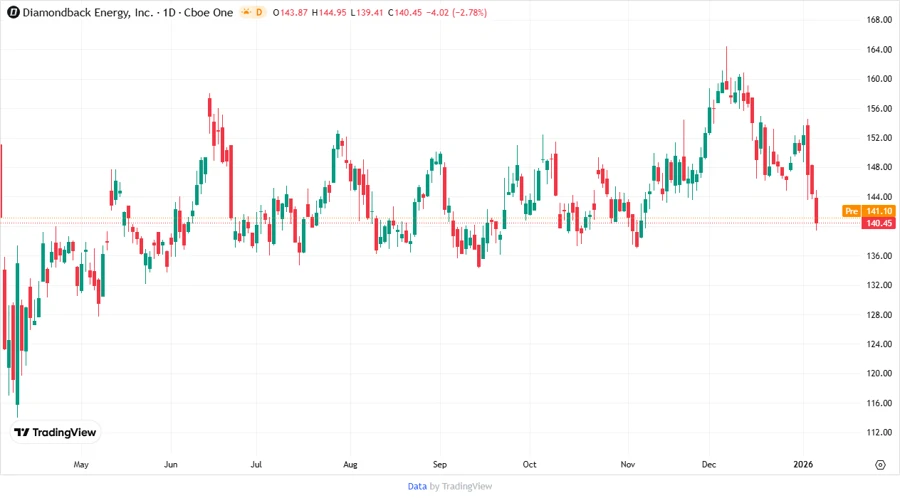
📈 Price Development
📊 Dividend Scoring System
| Category | Score | Bar |
|---|---|---|
| Dividend Yield | 3 | |
| Dividend Stability | 4 | |
| Dividend Growth | 2 | |
| Payout Ratio | 3 | |
| Financial Stability | 4 | |
| Dividend Continuity | 3 | |
| Cashflow Coverage | 2 | |
| Balance Sheet Quality | 4 |
Total Score: 25/40
🗣️ Rating
In conclusion, Diamondback Energy, Inc. offers a complex dividend profile with strategic advantages and potential risks. Its commitment to dividend payouts, alongside solid financial metrics, presents a cautiously positive outlook, though investors should remain vigilant about the recent dividend suspension. As such, Diamondback Energy positions itself as a viable investment for those prioritizing dividend income, with meticulous attention to financial movements being advisable.