July 05, 2025 a 02:46 am
FANG: Dividend Analysis - Diamondback Energy, Inc.
Diamondback Energy, Inc. shows a strong dividend profile with a current dividend yield of 3.69%. Despite facing challenges in the energy sector, this company has managed to sustain and grow its dividend, backed by solid fundamentals and a strategic approach to its capital allocation.
📊 Overview
The comprehensive overview of Diamondback Energy's dividend strategy reflects its resilience and strategic positioning within the energy sector.
| Data Point | Value |
|---|---|
| Sector | Energy |
| Dividend yield | 3.69 % |
| Current dividend per share | 7.39 USD |
| Dividend history | 8 years |
| Last cut or suspension | None |
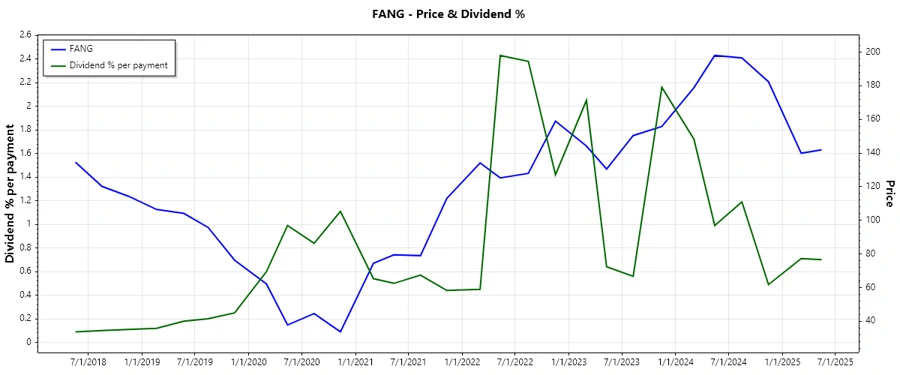
🗣️ Dividend History
With a dividend history spanning 8 years, Diamondback Energy proves its commitment to returning value to shareholders, crucially supporting investor confidence in volatile markets.
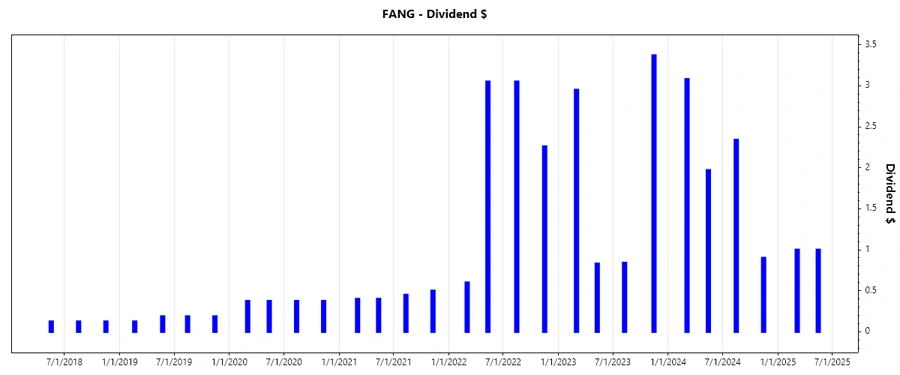
| Year | Dividend per Share (USD) |
|---|---|
| 2025 | 2.00 |
| 2024 | 8.29 |
| 2023 | 7.99 |
| 2022 | 8.96 |
| 2021 | 1.75 |
📈 Dividend Growth
Assessing both 3-year and 5-year growth rates at 0.68% and 0.65% respectively highlights Diamondback's ability to sustain moderate dividend growth, emphasizing a strategic approach to shareholder returns.
| Time | Growth |
|---|---|
| 3 years | 0.68 % |
| 5 years | 0.65 % |
The average dividend growth is 0.65% over 5 years. This shows moderate but steady dividend growth.
⚠️ Payout Ratio
Payout ratios are key to understanding a company's ability to sustain dividends. Diamondback's ratios show an EPS-based payout of 53.84% and an FCF-based payout of 84.40%, indicating a balanced but stretched dividend policy.
| Key figure | Ratio |
|---|---|
| EPS-based | 53.84 % |
| Free cash flow-based | 84.40 % |
The EPS ratio of 53.84% shows sustainable dividend practices, while the FCF ratio of 84.40% hints at caution regarding cash flow coverage.
✅ Cashflow & Capital Efficiency
Analyzing cash flows and capital efficiency metrics such as Free Cash Flow Yield and Earnings Yield provides insight into operational effectiveness and strategic flexibility.
| Metric | 2022 | 2023 | 2024 |
|---|---|---|---|
| Free Cash Flow Yield | 11.68% | 4.32% | 10.14% |
| Earnings Yield | 18.16% | 11.26% | 9.54% |
| CAPEX to Operating Cash Flow | 55.41% | 79.63% | 44.71% |
| Stock-based Compensation to Revenue | 0.61% | 0.65% | 0.59% |
| Free Cash Flow / Operating Cash Flow Ratio | 44.58% | 20.37% | 55.29% |
Although the CAPEX allocation and cash flow ratios present a mixed view, the overall cash flow stability supports its ongoing capital initiatives.
📉 Balance Sheet & Leverage Analysis
The strength of Diamondback's balance sheet is reflected in debt ratios and liquidity metrics, essential for assessing financial health and leverage.
| Metric | 2022 | 2023 | 2024 |
|---|---|---|---|
| Debt-to-Equity | 42.50% | 40.91% | 32.94% |
| Debt-to-Assets | 24.34% | 23.45% | 18.47% |
| Debt-to-Capital | 29.83% | 29.03% | 24.78% |
| Net Debt to EBITDA | 0.86 | 1.01 | 1.60 |
| Current Ratio | 0.81 | 0.77 | 0.43 |
| Quick Ratio | 0.77 | 0.74 | 0.41 |
| Financial Leverage | 1.75 | 1.74 | 1.78 |
The analysis reveals strong leverage control and a solid position to manage debt obligations, emphasizing favorable operating leverage.
✅ Fundamental Strength & Profitability
Profitability metrics including ROE, ROA, and various margin ratios illustrate Diamondback's ability to generate returns efficiently.
| Metric | 2022 | 2023 | 2024 |
|---|---|---|---|
| Return on Equity | 29.22% | 18.91% | 8.85% |
| Return on Assets | 16.73% | 10.84% | 4.96% |
| Net Profit Margin | 48.29% | 37.69% | 30.28% |
| Gross Profit Margin | 74.62% | 58.41% | 45.11% |
| EBIT Margin | 64.78% | 53.04% | 43.45% |
| EBITDA Margin | 79.71% | 74.00% | 69.33% |
| Research & Development to Revenue | 0 | 0 | 0 |
The balance of high margin sectors proves the potency of Diamondback's business model and confirms consistent profitability and strategic innovation.
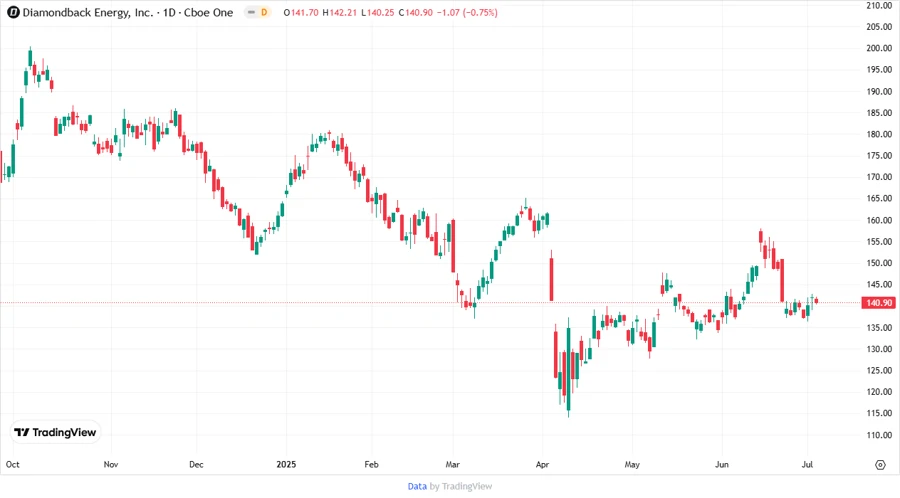
🏷️ Price Development
📈 Dividend Scoring System
| Criteria | Score | Indicator |
|---|---|---|
| Dividend yield | 4 | |
| Dividend Stability | 4 | |
| Dividend growth | 3 | |
| Payout ratio | 3 | |
| Financial stability | 5 | |
| Dividend continuity | 5 | |
| Cashflow Coverage | 3 | |
| Balance Sheet Quality | 4 |
The overall score is 31 out of 40.
📊 Rating
Diamondback Energy, Inc. receives a favorable rating based on its robust dividend yield, financial stability, and commitment to shareholder returns. Continued monitoring of cash flow metrics and leverage levels is advised. Investors may find this stock suitable for its steady returns bolstered by solid fundamentals.
Smart Data Insight
Master the Perfect Entry & Exit for this Stock
Don't leave your profits to chance. Historically, this stock follows specific seasonal patterns that institutional traders use to maximize returns.
- ✅ Identify the "Golden Buying Window"
- ✅ Avoid high-risk correction cycles
- ✅ Backtested data from the last 20+ years