June 20, 2025 a 03:31 pm


FANG: Dividend Analysis - Diamondback Energy, Inc.
Diamondback Energy, Inc., operates in the energy sector with a competitive market cap of USD 43.65 billion. The firm offers an appealing dividend yield of 3.69%, presenting as a dependable income-generating opportunity. With an ongoing history of consistent dividend payments for 8 years and no recent cuts or suspensions, it showcases stability and reliability for investors focused on steady income.
📊 Overview
Diamondback Energy plays a noteworthy role within the energy sector. With a current dividend yield of 3.69%, it stands strong in delivering shareholder value. Their commitment to dividends with an uninterrupted payout history over 8 years underscores financial reliability. The absence of recent dividend cuts further bolsters investor confidence in its stability.
| Sector | Dividend Yield | Current Dividend Per Share | Dividend History | Last Cut/Suspension |
|---|---|---|---|---|
| Energy | 3.69% | $7.39 | 8 years | None |
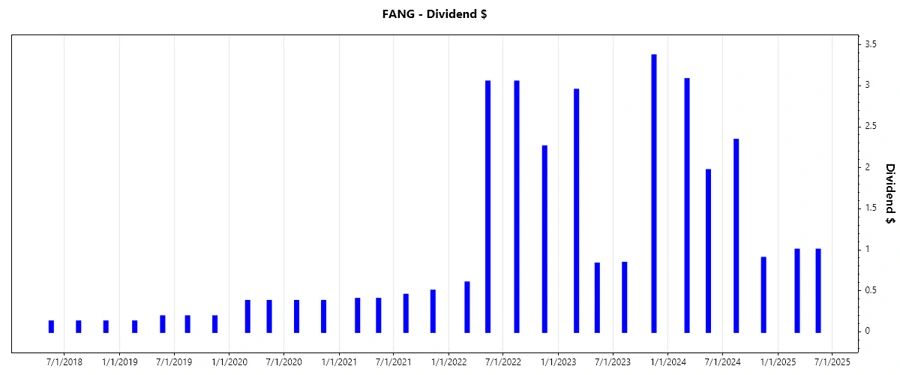
🗣️ Dividend History
Assessing dividend history provides insights into a company’s financial discipline and dedication to returning value to shareholders. A steadfast and gradually elevating dividend track, devoid of cuts, highlights robust financial health and management's confidence.
| Year | Dividend Per Share |
|---|---|
| 2025 | 2.00 |
| 2024 | 8.29 |
| 2023 | 7.99 |
| 2022 | 8.96 |
| 2021 | 1.75 |
📈 Dividend Growth
Sustainable dividend growth is an indicator of financial strength and future potential. Diamondback Energy, Inc.’s dividend growth of 0.68% over 3 years and 0.65% over 5 years signifies moderate expansion. Although not rapid, the growth indicates steady enhancement in shareholder equity.
| Time | Growth |
|---|---|
| 3 years | 0.68% |
| 5 years | 0.65% |
The average dividend growth is 0.65% over 5 years. This shows moderate but steady dividend growth.
📉 Payout Ratio
Payout ratios form the crux of dividend sustainability analysis. An EPS-based payout ratio of 53.84% reflects a balanced approach in retaining earnings while rewarding investors. FCF-based payout standing at 84.40% underscores a potential area for scrutiny regarding cash sustainability.
| Key Figure Ratio | Percentage |
|---|---|
| EPS-based | 53.84% |
| Free Cash Flow-based | 84.40% |
The EPS-based payout ratio of 53.84% suggests stable sustainability of dividend payments whereas the elevated FCF-based ratio signals a need to ensure adequate cash flow for future dividends.
💸 Cashflow & Capital Efficiency
Cash flow stability is essential for sustaining operations and funding dividends. Evaluating free cash flow and capital allocations evidences an intricate relationship that underpins profit reinvestment and shareholder distribution strategies.
| Metric | 2022 | 2023 | 2024 |
|---|---|---|---|
| Free Cash Flow Yield | 11.68% | 4.32% | 10.14% |
| Earnings Yield | 18.16% | 11.26% | 9.54% |
| CAPEX to Operating Cash Flow | 55.41% | 79.63% | 44.71% |
| Stock-based Compensation to Revenue | 0.61% | 0.65% | 0.59% |
| Free Cash Flow / Operating Cash Flow Ratio | 44.59% | 20.37% | 55.29% |
Consistency in cash flow metrics highlight Diamondback Energy’s proficient capital management, although periodic volatility suggests areas of potential improvement for sustained future performance.
🔍 Balance Sheet & Leverage Analysis
A robust balance sheet and prudent leverage control are prerequisites for financial stability and resilience in volatile market conditions.
| Metric | 2022 | 2023 | 2024 |
|---|---|---|---|
| Debt-to-Equity | 42.50% | 40.91% | 32.94% |
| Debt-to-Assets | 24.34% | 23.45% | 18.47% |
| Debt-to-Capital | 29.83% | 29.03% | 24.78% |
| Net Debt to EBITDA | 0.86x | 1.00x | 1.61x |
| Current Ratio | 0.81 | 0.77 | 0.44 |
| Quick Ratio | 0.77 | 0.74 | 0.41 |
| Financial Leverage | 1.75 | 1.74 | 1.78 |
The financial metrics indicate a well-managed debt structure with controlled leverage, affirming underlying business solidity and capacity to absorb financial shocks.
📈 Fundamental Strength & Profitability
Evaluating profitability metrics and fundamental performance sheds light on operational efficiency and strategic advantage.
| Metric | 2022 | 2023 | 2024 |
|---|---|---|---|
| Return on Equity | 29.22% | 18.91% | 8.85% |
| Return on Assets | 16.73% | 10.84% | 4.96% |
| Net Margin | 48.29% | 37.69% | 30.28% |
| EBIT Margin | 64.78% | 53.04% | 43.45% |
| EBITDA Margin | 79.71% | 74.00% | 69.33% |
| Gross Margin | 74.62% | 58.41% | 45.11% |
| R&D to Revenue | 0% | 0% | 0% |
The robust margins and returns reflect Diamondback Energy's proficiency in optimizing operations and enhancing shareholder value, despite challenging economic landscapes.
📉 Price Development
✅ Dividend Scoring System
| Criteria | Score | Visualization |
|---|---|---|
| Dividend Yield | 3 | |
| Dividend Stability | 4 | |
| Dividend Growth | 2 | |
| Payout Ratio | 4 | |
| Financial Stability | 3 | |
| Dividend Continuity | 5 | |
| Cashflow Coverage | 3 | |
| Balance Sheet Quality | 4 |
Overall Score: 28/40
🟢 Rating
Diamondback Energy, Inc. provides a lucrative opportunity with solid financials, stable dividend payouts, and a commendable payout track record. While some ratios indicate potential areas for enhancement, the company's overall financial health supports a favorable investment stance, aligning well with conservative income-focused portfolios. Consideration of these factors reflects a moderate buy recommendation with emphasis on future dividend growth potential.
Smart Data Insight
Master the Perfect Entry & Exit for this Stock
Don't leave your profits to chance. Historically, this stock follows specific seasonal patterns that institutional traders use to maximize returns.
- ✅ Identify the "Golden Buying Window"
- ✅ Avoid high-risk correction cycles
- ✅ Backtested data from the last 20+ years