
September 30, 2026 a 09:32 am


Energy Stocks - Performance Analysis
In the dynamic and ever-volatile energy sector, understanding stock performance is crucial for making informed investment decisions. Over recent periods, various stocks have shown distinct trends and contrasting performances. This analysis delves into these differences, highlighting key performers and identifying patterns that might drive future decision-making.
📊 Energy Stocks Performance One Week
| Stock | Performance (%) | Performance |
|---|---|---|
| MPC | 0.95 | |
| XOM | 0.08 | |
| CVX | -0.53 | |
| PSX | -1.66 | |
| EOG | -1.53 | |
| COP | -2.07 | |
| KMI | -2.96 | |
| WMB | -3.53 | |
| SLB | -3.89 | |
| OKE | -4.09 |
📊 Energy Stocks Performance One Month
| Stock | Performance (%) | Performance |
|---|---|---|
| MPC | 5.25 | |
| PSX | 2.55 | |
| XOM | 0.52 | |
| CVX | -0.64 | |
| EOG | -3.37 | |
| COP | -5.05 | |
| KMI | -5.58 | |
| WMB | -8.82 | |
| OKE | -9.81 | |
| SLB | -18.23 |
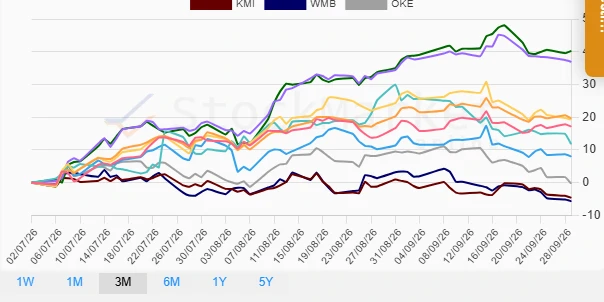
📊 Energy Stocks Performance Three Months
| Stock | Performance (%) | Performance |
|---|---|---|
| MPC | 40.23 | |
| PSX | 36.96 | |
| CVX | 19.63 | |
| COP | 19.25 | |
| SLB | 11.78 | |
| EOG | 7.98 | |
| XOM | 17.16 | |
| OKE | -0.29 | |
| KMI | -4.60 | |
| WMB | -5.65 |
Summary
Throughout this analysis, MPC consistently emerged as the top performer, particularly in the three-month period where it achieved a staggering 40.23% increase. On the contrary, OKE often lagged, demonstrating weaker performance across the shorter timeframes. The energy sector exhibits substantial volatility and varied performance, highlighting the necessity for focused stock selection. Investors may find potential in strong growth stocks like MPC and PSX while exercising caution with underperformers such as WMB and KMI.
Smart Data Insight
Master the Perfect Entry & Exit for this Stock
Don't leave your profits to chance. Historically, this stock follows specific seasonal patterns that institutional traders use to maximize returns.
- ✅ Identify the "Golden Buying Window"
- ✅ Avoid high-risk correction cycles
- ✅ Backtested data from the last 20+ years