October 29, 2025 a 09:32 am


Energy Stocks - Performance Analysis
🔍 The energy sector's stock performance has shown significant volatility over the past three months. Notably, the sector's growth trajectory varies substantially across different periods, with certain stocks exhibiting remarkable growth and others indicative of underperformance.
Energy Stocks Performance One Week 📊
| Stock | Performance (%) | Performance |
|---|---|---|
| SLB | 2.77 | |
| MPC | 2.03 | |
| PSX | 1.78 | |
| XOM | 0.30 | |
| EOG | -0.25 | |
| COP | -0.62 | |
| OKE | -0.69 | |
| CVX | -0.92 | |
| KMI | -5.39 | |
| WMB | -7.47 |
Energy Stocks Performance One Month 📊
| Stock | Performance (%) | Performance |
|---|---|---|
| SLB | 2.52 | |
| XOM | 0.81 | |
| MPC | -1.88 | |
| CVX | -1.19 | |
| PSX | -2.63 | |
| OKE | -5.51 | |
| EOG | -6.64 | |
| KMI | -8.20 | |
| COP | -9.61 | |
| WMB | -10.25 |
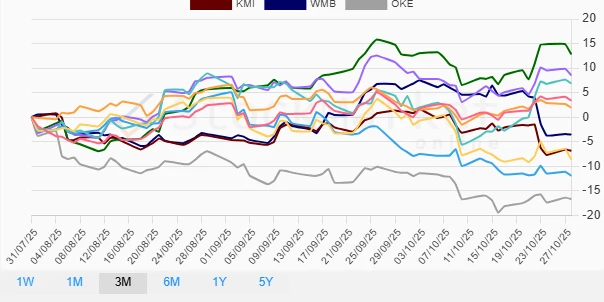
Energy Stocks Performance Three Months 📊
| Stock | Performance (%) | Performance |
|---|---|---|
| MPC | 12.84 | |
| PSX | 8.55 | |
| SLB | 6.87 | |
| XOM | 3.40 | |
| CVX | 1.96 | |
| WMB | -3.54 | |
| KMI | -6.84 | |
| COP | -8.59 | |
| EOG | -11.91 | |
| OKE | -16.65 |
Summary ✅
💡 Conclusively, the energy sector has exhibited heterogeneous performance over different time frames. Stocks such as MPC have demonstrated commendable resilience and have yielded substantial gains, particularly over the quarterly period. Conversely, several stocks, notably OKE and EOG, reflect persistent underperformance. Investors should consider these dynamics and volatility aspects when evaluating potential investments in the energy sector to align with their risk appetite and return expectations.
Smart Data Insight
Master the Perfect Entry & Exit for this Stock
Don't leave your profits to chance. Historically, this stock follows specific seasonal patterns that institutional traders use to maximize returns.
- ✅ Identify the "Golden Buying Window"
- ✅ Avoid high-risk correction cycles
- ✅ Backtested data from the last 20+ years