
July 29, 2026 a 09:32 am


Energy Stocks - Performance Analysis
In the recent analysis of the energy sector, an examination of both short-term volatility and long-term productivity reveals distinctive trends. Over the one-week, one-month, and three-month periods, diverse performance patterns provide insights into the sector's resilience and challenges. This performance review will highlight top performers, identify underperformers, and discuss potential driving factors behind these changes.
Energy Stocks Performance One Week
🔍 Over the past week, we observe substantial variability with SLB emerging as a standout performer, exhibiting a 5.36% positive shift. Conversely, WMB stock trails with a significant decline of -5.87%. It suggests heightened sensitivity across energy stocks to market fluctuations and sector-specific news.
| Stock | Performance (%) | Performance |
|---|---|---|
| SLB | 5.36 | |
| XOM | -0.89 | |
| CVX | -2.79 | |
| PSX | -2.64 | |
| KMI | -2.69 | |
| EOG | -2.98 | |
| MPC | -3.10 | |
| OKE | -3.18 | |
| COP | -3.93 | |
| WMB | -5.87 |
Energy Stocks Performance One Month
📈 The one-month overview demonstrates robust growth with PSX leading the charge at a notable 17.30%. A few entities like WMB and KMI showed losses, revealing partial weaknesses in specific sub-sectors or business strategies within the broader market.
| Stock | Performance (%) | Performance |
|---|---|---|
| PSX | 17.30 | |
| MPC | 17.10 | |
| XOM | 12.05 | |
| CVX | 11.01 | |
| COP | 9.45 | |
| SLB | 8.25 | |
| EOG | 6.08 | |
| OKE | 0.38 | |
| KMI | -1.92 | |
| WMB | -6.49 |
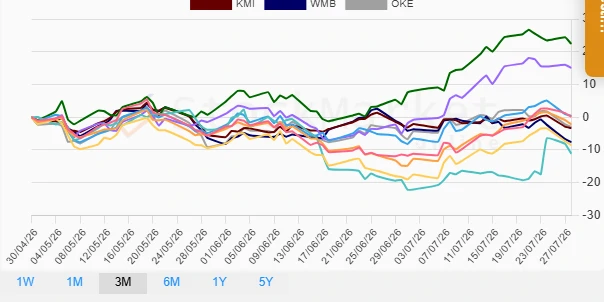
Energy Stocks Performance Three Months
📉 The long-term view over three months displays a mixed bag of outcomes. While MPC achieved a remarkable 22.42% gain, SLB showed the most significant decrease at -11.13%. Such discrepancies underscore diverse geographical and operational sensitivities in the energy domain.
| Stock | Performance (%) | Performance |
|---|---|---|
| MPC | 22.42 | |
| PSX | 15.06 | |
| EOG | 0.46 | |
| XOM | 0.14 | |
| OKE | -2.94 | |
| CVX | -2.17 | |
| KMI | -3.33 | |
| WMB | -7.58 | |
| COP | -8.58 | |
| SLB | -11.13 |
Summary
✅ The energy sector showcases a diverse array of performances across different timeframes. Short-term volatility significantly affects weekly and monthly results, with key players like SLB and PSX leading in performance during intense market conditions. Yet, over three months, the sector's resilience is highlighted by elevated stocks like MPC. Strategic portfolio diversification remains critical for investors aiming to mitigate risks and capitalize on growth opportunities in this dynamic sector.
Smart Data Insight
Master the Perfect Entry & Exit for this Stock
Don't leave your profits to chance. Historically, this stock follows specific seasonal patterns that institutional traders use to maximize returns.
- ✅ Identify the "Golden Buying Window"
- ✅ Avoid high-risk correction cycles
- ✅ Backtested data from the last 20+ years