
August 26, 2026 a 09:32 am


Energy Stocks - Performance Analysis
The energy sector has experienced fluctuations over the recent weeks and months, demonstrating both opportunities and challenges in an evolving market. While some stocks have shown resilience, others have faced downward pressure. This analysis explores these trends, offering insights into the relative performance of major energy stocks.
Energy Stocks Performance One Week
| Stock | Performance (%) | Performance |
|---|---|---|
| COP | 1.03 | |
| SLB | -0.47 | |
| MPC | -1.61 | |
| EOG | -1.73 | |
| PSX | -2.21 | |
| XOM | -2.51 | |
| CVX | -2.88 | |
| WMB | -2.96 | |
| KMI | -3.59 | |
| OKE | -4.56 |
Energy Stocks Performance One Month
| Stock | Performance (%) | Performance |
|---|---|---|
| COP | 13.57 | |
| PSX | 13.56 | |
| MPC | 13.54 | |
| CVX | 5.35 | |
| EOG | 5.21 | |
| XOM | 3.99 | |
| SLB | 3.81 | |
| OKE | 2.78 | |
| WMB | 0.66 | |
| KMI | -2.38 |
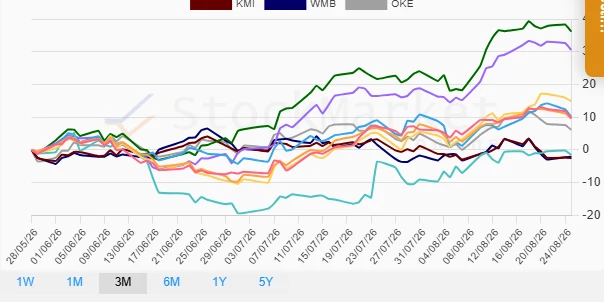
Energy Stocks Performance Three Months
| Stock | Performance (%) | Performance |
|---|---|---|
| MPC | 36.20 | |
| PSX | 30.57 | |
| COP | 14.86 | |
| EOG | 10.11 | |
| XOM | 9.76 | |
| CVX | 9.60 | |
| OKE | 6.18 | |
| SLB | -1.49 | |
| WMB | -2.09 | |
| KMI | -2.52 |
Summary
Throughout the three periods analyzed, the energy sector has demonstrated a range of performance across its key stocks. Over the short term (1 week), most companies faced negative performance with OKE underperforming significantly. In contrast, the same period over a month shows positive resilience, particularly for COP and PSX. Extending to three months, companies like MPC and PSX reveal outstanding growth, marking them as top performers. This suggests strategic allocations focusing on specific outperformers could yield favorable results in a turbulent market landscape.
Smart Data Insight
Master the Perfect Entry & Exit for this Stock
Don't leave your profits to chance. Historically, this stock follows specific seasonal patterns that institutional traders use to maximize returns.
- ✅ Identify the "Golden Buying Window"
- ✅ Avoid high-risk correction cycles
- ✅ Backtested data from the last 20+ years