
June 24, 2026 a 09:32 am


Energy Stocks - Performance Analysis
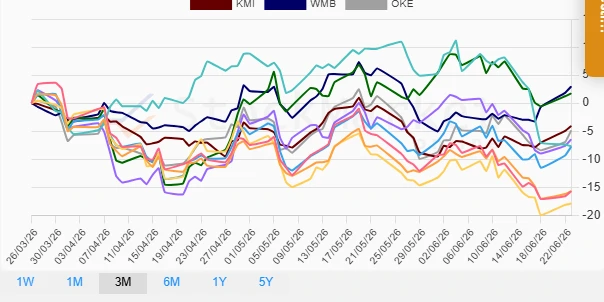
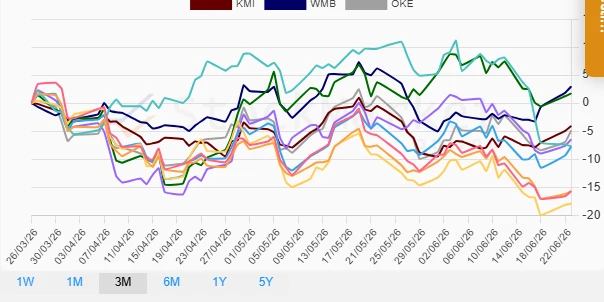
The energy sector has experienced significant fluctuations over the past weeks and months, influenced by various macroeconomic and geopolitical factors. This analysis provides an in-depth examination of the performance of major energy stocks over three distinct time periods: one week, one month, and three months. Identifying trends such as top performers and underperformers offers insights into the current state of the energy market.
Energy Stocks Performance One Week 📊
| Stock | Performance (%) | Performance |
|---|---|---|
| WMB | 6.24 | |
| KMI | 3.82 | |
| OKE | 2.89 | |
| PSX | 1.90 | |
| MPC | 1.61 | |
| EOG | 1.30 | |
| XOM | -0.69 | |
| CVX | -0.87 | |
| COP | -1.05 | |
| SLB | -5.07 |
Energy Stocks Performance One Month 📊
| Stock | Performance (%) | Performance |
|---|---|---|
| MPC | -2.00 | |
| WMB | -3.24 | |
| PSX | -3.95 | |
| KMI | -3.54 | |
| EOG | -4.18 | |
| OKE | -6.15 | |
| COP | -8.70 | |
| CVX | -8.13 | |
| XOM | -9.97 | |
| SLB | -17.39 |
Energy Stocks Performance Three Months 📊
| Stock | Performance (%) | Performance |
|---|---|---|
| WMB | 2.96 | |
| MPC | 1.73 | |
| PSX | -6.45 | |
| SLB | -7.68 | |
| EOG | -7.77 | |
| OKE | -4.88 | |
| KMI | -4.05 | |
| CVX | -15.67 | |
| XOM | -15.69 | |
| COP | -17.88 |
Summary ✅
The energy sector has demonstrated mixed performance across the analyzed periods. Notably, WMB emerged as a consistent outperformer in the short term, indicating potential resilience or strategic advantage in current market conditions. In contrast, companies such as COP and SLB have underperformed, potentially due to sector-specific challenges or macroeconomic factors. Investors should closely monitor these trends, considering external factors such as commodity price fluctuations and regulatory changes that could continue to impact the energy market's performance.
Smart Data Insight
Master the Perfect Entry & Exit for this Stock
Don't leave your profits to chance. Historically, this stock follows specific seasonal patterns that institutional traders use to maximize returns.
- ✅ Identify the "Golden Buying Window"
- ✅ Avoid high-risk correction cycles
- ✅ Backtested data from the last 20+ years