
September 23, 2026 a 09:32 am


Energy Stocks - Performance Analysis
The energy sector has exhibited significant volatility in recent weeks. Within this period, variables such as global oil prices, geopolitical factors, and changing demand have played pivotal roles in stock performance. In this analysis, we delve into the intricate performance patterns of leading energy stocks over three different time frames. By closely examining weekly, monthly, and quarterly data, we aim to provide insights into emerging trends and strategic implications for stakeholders.
📊 Energy Stocks Performance One Week
Over the past week, energy stocks have shown mixed performance. Notably, Kinder Morgan, Inc. (KMI) and Williams Companies (WMB) emerged as top gainers, while Marathon Petroleum (MPC) lagged behind. Various factors, such as short-term oil price fluctuations and supply chain constraints, have impacted these movements.
| Stock | Performance (%) | Performance |
|---|---|---|
| KMI | 1.78 | |
| WMB | 0.11 | |
| SLB | -0.31 | |
| PSX | -2.84 | |
| OKE | -2.82 | |
| XOM | -2.80 | |
| CVX | -4.37 | |
| EOG | -3.78 | |
| COP | -5.56 | |
| MPC | -5.83 |
📊 Energy Stocks Performance One Month
Within the past month, energy stocks have depicted a continuum of varied performance metrics. Marathon Petroleum (MPC) and Phillips 66 (PSX) achieved the highest gains, signaling effective capital management and favorable market conditions. Contrarily, EOG Resources (EOG) showed the weakest performance, greatly influenced by competitive sector dynamics and external market pressures.
| Stock | Performance (%) | Performance |
|---|---|---|
| MPC | 7.63 | |
| PSX | 6.29 | |
| KMI | 1.07 | |
| WMB | 0.23 | |
| CVX | -0.11 | |
| XOM | -2.99 | |
| OKE | -2.98 | |
| SLB | -2.91 | |
| COP | -5.84 | |
| EOG | -7.02 |
📊 Energy Stocks Performance Three Months
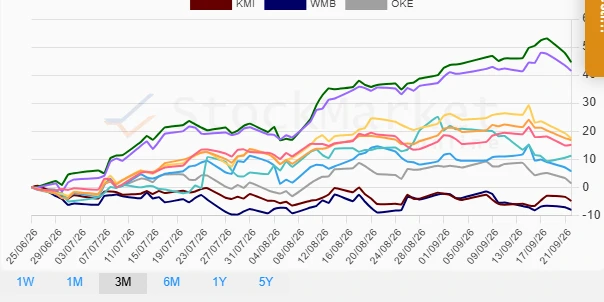
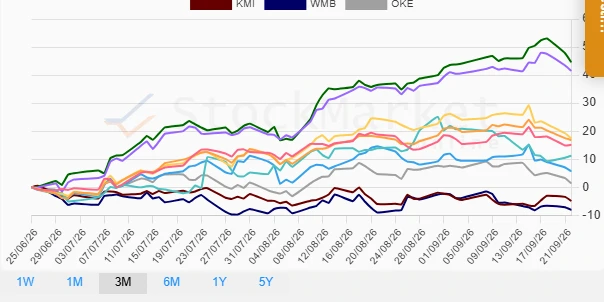
Over the past three months, the energy sector has showcased significant rallies, primarily driven by Phillips 66 (PSX) and Marathon Petroleum (MPC), both exceeding a 40% increase. Such growth indicates robust operational efficiency and successful market penetration. Conversely, Williams Companies (WMB) faced substantial challenges, recording a downturn in value.
| Stock | Performance (%) | Performance |
|---|---|---|
| MPC | 44.63 | |
| PSX | 41.53 | |
| COP | 17.51 | |
| CVX | 16.90 | |
| XOM | 15.17 | |
| SLB | 11.26 | |
| EOG | 5.75 | |
| OKE | 1.45 | |
| KMI | -4.82 | |
| WMB | -8.03 |
🗣️ Summary
The energy sector continues to be influenced by external market forces, presenting both opportunities and risks. Over the short term, factors such as energy demands, resource pricing, and geopolitical tensions will remain pivotal. Strategic positioning in industry leaders like Marathon Petroleum and Phillips 66 offers promising returns, given their strong quarterly performance. However, the volatility observed in entities like Williams Companies suggests a need for careful market observation and diversified investment strategies. Investors are advised to maintain a balanced portfolio approach, considering both high-performing stocks and potential underdogs like EOG Resources for hedging benefits.
Smart Data Insight
Master the Perfect Entry & Exit for this Stock
Don't leave your profits to chance. Historically, this stock follows specific seasonal patterns that institutional traders use to maximize returns.
- ✅ Identify the "Golden Buying Window"
- ✅ Avoid high-risk correction cycles
- ✅ Backtested data from the last 20+ years