
July 22, 2026 a 09:32 am


Energy Stocks - Performance Analysis
In the recent analysis of the energy sector, significant performance differences are observed between major stocks over varying time horizons. This detailed review will examine the trends over one week, one month, and three months to understand market dynamics. Identifying top performers and laggards allows investors to strategically position their portfolios for optimal returns.
Energy Stocks Performance One Week 📊
The short-term analysis for one week shows a notable variance in stock performance. Phillips 66 (PSX) leads the gains, while Schlumberger (SLB) trails behind. Such variations highlight the volatility and rapid market shifts common within the energy sector.
| Stock | Performance (%) | Performance |
|---|---|---|
| PSX | 7.98 | |
| MPC | 6.72 | |
| COP | 5.32 | |
| CVX | 5.11 | |
| XOM | 4.91 | |
| EOG | 4.28 | |
| OKE | 0.91 | |
| KMI | 0.58 | |
| WMB | -1.36 | |
| SLB | -2.03 |
Energy Stocks Performance One Month 📈
Over a one-month period, Marathon Petroleum (MPC) showcases substantial growth, indicating strong investor confidence. In contrast, Schlumberger (SLB) continues its downturn, highlighting sector-specific risks.
| Stock | Performance (%) | Performance |
|---|---|---|
| MPC | 26.21 | |
| PSX | 23.69 | |
| XOM | 9.40 | |
| CVX | 9.02 | |
| EOG | 8.01 | |
| COP | 7.20 | |
| OKE | 6.49 | |
| KMI | 0.55 | |
| WMB | -1.91 | |
| SLB | -2.70 |
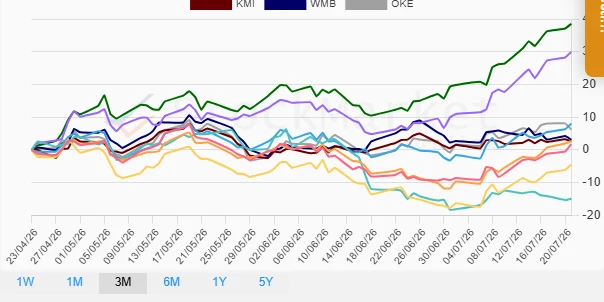
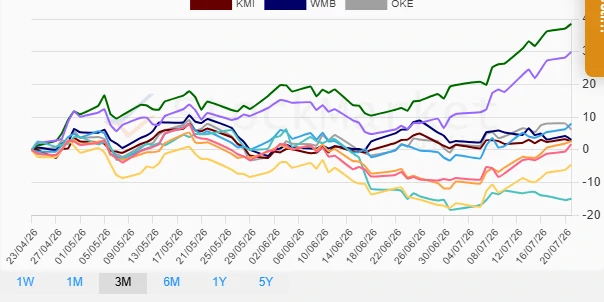
Energy Stocks Performance Three Months 📉
The three-month analysis indicates a robust uptrend for Marathon Petroleum (MPC) with significant gains, whereas Schlumberger (SLB) suffers huge losses, marking it as the clear underperformer. Such disparities emphasize long-term strategic risks and opportunities in the energy sector.
| Stock | Performance (%) | Performance |
|---|---|---|
| MPC | 38.50 | |
| PSX | 29.91 | |
| EOG | 7.99 | |
| WMB | 3.16 | |
| CVX | 2.68 | |
| KMI | 2.66 | |
| OKE | 6.27 | |
| XOM | 1.77 | |
| COP | -4.52 | |
| SLB | -14.90 |
Summary 🗣️
In summary, Marathon Petroleum (MPC) consistently outperforms across multiple timeframes with significant returns, making it a standout in the energy sector. Conversely, Schlumberger (SLB) faces notable challenges, evident from its recurrent underperformance. Investors should consider these dynamics when forming strategic decisions, taking note of the inherent risks and opportunities within this volatile sector.
Smart Data Insight
Master the Perfect Entry & Exit for this Stock
Don't leave your profits to chance. Historically, this stock follows specific seasonal patterns that institutional traders use to maximize returns.
- ✅ Identify the "Golden Buying Window"
- ✅ Avoid high-risk correction cycles
- ✅ Backtested data from the last 20+ years