
April 22, 2026 a 09:32 am


Energy Stocks - Performance Analysis
In the past weeks, the energy sector has experienced significant fluctuations. Amidst global economic changes and geopolitical dynamics, certain energy stocks have displayed impressive gains while others have underperformed. This analysis delves into the performance of the top energy stocks over various timeframes to provide insight into trends and potential opportunities.
Energy Stocks Performance One Week 📊
During the last week, the energy sector showed a mixed performance with both gains and losses. Occidental Petroleum (COP) led the gains, reflecting positive market sentiment or potential internal growth strategies. On the other hand, Phillips 66 (PSX) and Marathon Petroleum (MPC) saw notable declines, which could be attributed to external pressures or market corrections.
| Stock | Performance (%) | Performance |
|---|---|---|
| COP | 1.30% | |
| OKE | 0.73% | |
| SLB | 0.70% | |
| CVX | 0.63% | |
| EOG | 0.16% | |
| KMI | -0.41% | |
| WMB | -0.47% | |
| XOM | -0.35% | |
| MPC | -1.00% | |
| PSX | -1.16% |
Energy Stocks Performance One Month 📊
The monthly performance reflects broader sector challenges, with most stocks experiencing declines. Nonetheless, Schlumberger (SLB) reported a robust 7.24% increase, indicating strong operational momentum or positive investor sentiment. Meanwhile, the significant drops seen in Phillips 66 (PSX) and Chevron (CVX) mark areas of concern, potentially driven by sector-wide pressures or company-specific issues.
| Stock | Performance (%) | Performance |
|---|---|---|
| SLB | 7.24% | |
| WMB | -4.31% | |
| MPC | -4.67% | |
| EOG | -4.89% | |
| COP | -5.07% | |
| OKE | -5.67% | |
| KMI | -6.51% | |
| XOM | -7.74% | |
| CVX | -9.46% | |
| PSX | -9.80% |
Energy Stocks Performance Three Months 📊
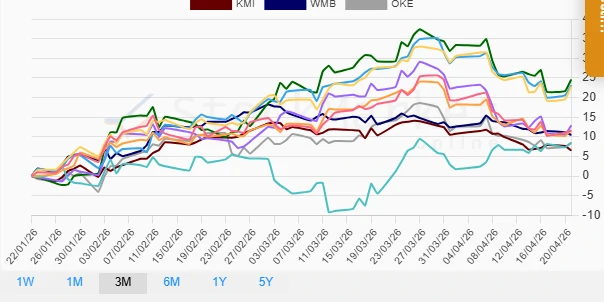
Over the past three months, the energy sector has showcased impressive resilience, with several stocks demonstrating double-digit growth. Marathon Petroleum (MPC) and EOG Resources (EOG) were notable performers, gaining over 20%, likely driven by strategic developments or favorable market conditions. This upward movement reflects positively on the overall market perception of the energy sector's future trajectory.
| Stock | Performance (%) | Performance |
|---|---|---|
| MPC | 24.56% | |
| EOG | 23.08% | |
| COP | 22.80% | |
| PSX | 12.88% | |
| CVX | 11.71% | |
| XOM | 11.56% | |
| WMB | 10.49% | |
| OKE | 8.54% | |
| SLB | 8.41% | |
| KMI | 6.51% |
Summary 📈
The analysis of the energy sector over varying time frames presents a multifaceted picture of market dynamics. While short-term performances indicate volatility, the three-month trend is indicative of the sector's resilience and potential for sustained growth. Carefully selected stocks, especially those with consistent upward trajectories like Marathon Petroleum and EOG Resources, may offer lucrative opportunities. Investors should remain vigilant of macroeconomic factors influencing the sector while considering both global energy demands and green energy transition initiatives that could redefine future growth paths.
Smart Data Insight
Master the Perfect Entry & Exit for this Stock
Don't leave your profits to chance. Historically, this stock follows specific seasonal patterns that institutional traders use to maximize returns.
- ✅ Identify the "Golden Buying Window"
- ✅ Avoid high-risk correction cycles
- ✅ Backtested data from the last 20+ years