
August 19, 2026 a 09:32 am


Energy Stocks - Performance Analysis
📊 The energy sector has shown dynamic movements across different time frames. With a backdrop of fluctuating oil prices and global economic developments, understanding the performance trends of major energy stocks is crucial for investors. This analysis will dissect the short-term, medium-term, and long-term shifts in energy stock valuations.
Energy Stocks Performance One Week
📈 The one-week performance analysis reveals notable gains across the sector, with Phillips 66 (PSX) leading at a 7.74% increase. Marathon Petroleum (MPC) and Chevron (CVX) also demonstrated strong growth. Kinder Morgan (KMI) and Exxon Mobil (XOM) had moderate rises. These short-term gains are potentially driven by recent macroeconomic events influencing oil demand.
| Stock | Performance (%) | Performance |
|---|---|---|
| PSX | 7.74 | |
| MPC | 5.08 | |
| OKE | 4.91 | |
| CVX | 4.57 | |
| EOG | 3.86 | |
| KMI | 3.59 | |
| XOM | 3.62 | |
| WMB | 2.02 | |
| COP | 1.94 | |
| SLB | 1.19 |
Energy Stocks Performance One Month
🔍 Over the past month, Phillips 66 (PSX) and Marathon Petroleum (MPC) have shown remarkable performances, strengthening their positions in the energy sector. Schlumberger’s (SLB) impressive 14.76% growth highlights its operational efficiency in the current market climate. ConocoPhillips (COP) also had substantial growth, while Kinder Morgan (KMI) remains stable amid industry volatility.
| Stock | Performance (%) | Performance |
|---|---|---|
| PSX | 15.85 | |
| MPC | 15.74 | |
| SLB | 14.76 | |
| COP | 11.90 | |
| XOM | 11.28 | |
| CVX | 8.42 | |
| EOG | 5.98 | |
| OKE | 4.05 | |
| WMB | 1.62 | |
| KMI | 1.09 |
Energy Stocks Performance Three Months
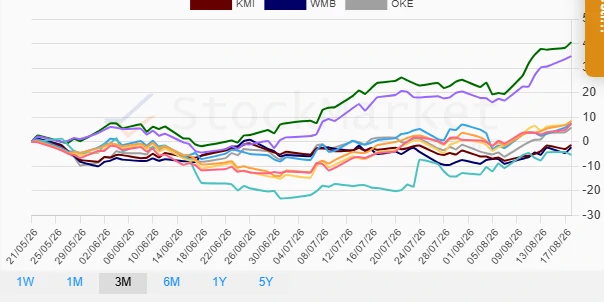
📉 The three-month outlook presents a mixed picture. While Marathon Petroleum (MPC) recorded a staggering 40.54% growth, signaling robust strength, certain stocks like Schlumberger (SLB) faced a downturn, highlighting market challenges. Despite these, the sector generally sustained positivity with strategic gains.
| Stock | Performance (%) | Performance |
|---|---|---|
| MPC | 40.54 | |
| PSX | 34.87 | |
| COP | 8.51 | |
| CVX | 8.28 | |
| EOG | 7.47 | |
| XOM | 7.30 | |
| OKE | 5.71 | |
| KMI | -1.32 | |
| WMB | -2.34 | |
| SLB | -5.38 |
Summary
✅ In conclusion, the energy sector's performance over these timeframes suggests resilience and opportunity. The consistently strong performance of Phillips 66 and Marathon Petroleum highlights robust business models capable of navigating market challenges. However, caution is advised as Schlumberger's downturn points to underlying risks in certain areas. Diversified investment approaches may be beneficial to balance gains and manage potential volatility.
Smart Data Insight
Master the Perfect Entry & Exit for this Stock
Don't leave your profits to chance. Historically, this stock follows specific seasonal patterns that institutional traders use to maximize returns.
- ✅ Identify the "Golden Buying Window"
- ✅ Avoid high-risk correction cycles
- ✅ Backtested data from the last 20+ years