
November 18, 2026 a 09:31 am


Energy Stocks - Performance Analysis
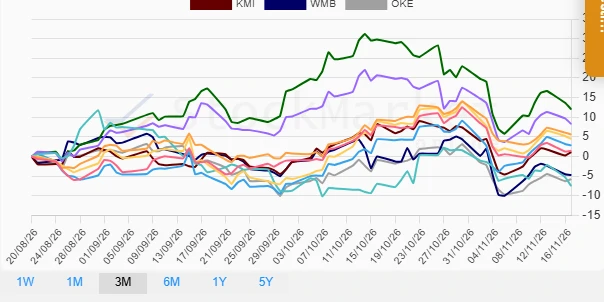
The energy sector has experienced considerable fluctuations over the past quarter, driven by a mix of macroeconomic factors and sector-specific developments. In the short-term view, volatility has been observed across different stocks with some companies showcasing resilience while others underperform. This analysis aims to provide insights into the week-over-week, month-over-month, and quarterly performances to offer a clearer view of market dynamics.
Energy Stocks Performance One Week 📊
| Stock | Performance (%) | Performance |
|---|---|---|
| CVX | 1.36% | |
| COP | 1.21% | |
| EOG | 0.77% | |
| OKE | 0.45% | |
| KMI | 0.37% | |
| XOM | 0.34% | |
| PSX | -0.64% | |
| MPC | -1.72% | |
| WMB | -2.11% | |
| SLB | -3.95% |
Energy Stocks Performance One Month 📈
| Stock | Performance (%) | Performance |
|---|---|---|
| SLB | 0.28% | |
| EOG | -1.31% | |
| CVX | -3.46% | |
| WMB | -3.47% | |
| COP | -3.58% | |
| OKE | -3.94% | |
| KMI | -4.82% | |
| XOM | -6.05% | |
| PSX | -11.51% | |
| MPC | -16.83% |
Energy Stocks Performance Three Months 📉
| Stock | Performance (%) | Performance |
|---|---|---|
| MPC | 12.02% | |
| PSX | 8.27% | |
| CVX | 5.60% | |
| COP | 4.48% | |
| EOG | 2.83% | |
| XOM | 1.45% | |
| KMI | 1.11% | |
| WMB | -4.73% | |
| OKE | -5.77% | |
| SLB | -7.52% |
Summary 🗣️
The energy stocks analyzed demonstrate a diverse range of performances over the short to mid-term period. Short-term fluctuations, particularly in the weekly view, highlight market volatility with some stocks like CVX and COP outperforming while others such as SLB experienced notable declines. Over the three-month horizon, resilience is seen in companies like MPC and PSX with significant gains, whereas SLB continues to display underperformance. Investors should consider these trends alongside broader market conditions, as some stocks reveal robust growth potential while others may still face headwinds. Strategic portfolio adjustments might be beneficial in harnessing the dynamic shifts observed.
Smart Data Insight
Master the Perfect Entry & Exit for this Stock
Don't leave your profits to chance. Historically, this stock follows specific seasonal patterns that institutional traders use to maximize returns.
- ✅ Identify the "Golden Buying Window"
- ✅ Avoid high-risk correction cycles
- ✅ Backtested data from the last 20+ years