February 18, 2026 a 09:31 am


Energy Stocks - Performance Analysis
In the volatile landscape of energy markets, understanding the performance metrics of major stocks is pivotal. This analysis delves into the performance of key players over three distinct time periods: one week, one month, and three months. Through comprehensive tables and graphical representations, this report aims to provide strategic insights into emerging trends and significant shifts within the sector.
Energy Stocks Performance One Week 📉
| Stock | Performance (%) | Performance |
|---|---|---|
| XOM | -6.13% | |
| KMI | 2.16% | |
| EOG | 1.32% | |
| WMB | 1.19% | |
| OKE | 0.85% | |
| COP | -2.18% | |
| PSX | -2.00% | |
| CVX | -2.85% | |
| SLB | -3.36% | |
| MPC | -3.78% |
Energy Stocks Performance One Month 📈
| Stock | Performance (%) | Performance |
|---|---|---|
| WMB | 15.95% | |
| OKE | 14.47% | |
| KMI | 14.15% | |
| MPC | 13.87% | |
| PSX | 13.82% | |
| EOG | 13.25% | |
| XOM | 12.18% | |
| COP | 10.60% | |
| SLB | 6.93% | |
| CVX | 8.44% |
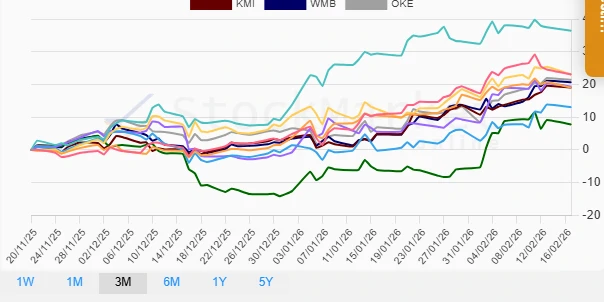
Energy Stocks Performance Three Months 🗓️📈
| Stock | Performance (%) | Performance |
|---|---|---|
| SLB | 36.38% | |
| COP | 23.06% | |
| XOM | 23.04% | |
| OKE | 21.42% | |
| WMB | 20.67% | |
| KMI | 19.01% | |
| CVX | 18.99% | |
| PSX | 19.34% | |
| EOG | 13.05% | |
| MPC | 7.77% |
Summary 🗣️✅
The energy sector has demonstrated dynamic shifts over the analyzed periods. Over the past week, stocks like KMI and EOG have led gains, while XOM significantly underperformed. The monthly analysis reveals a robust uptrend where WMB and OKE outpaced others, reflecting a strong sectoral recovery. On a quarterly basis, SLB has emerged as an exceptional performer, pointing toward strategic execution and perhaps favorable sector rotations. Consequently, investors should consider potential opportunities in diversified energy exposures, emphasizing portfolios with balanced sectoral and individual stock allocations for sustained growth potential.