June 17, 2026 a 09:31 am


Energy Stocks - Performance Analysis
In recent weeks, the energy sector has faced significant challenges across various timeframes, primarily marked by a downtrend in major stock prices. This reflects global economic pressures and market volatility. However, opportunities for strategic investments remain, highlighting the importance of a detailed performance review.
📊 Energy Stocks Performance One Week
| Stock | Performance (%) | Performance |
|---|---|---|
| KMI | -1.22 | |
| WMB | -1.08 | |
| SLB | -4.39 | |
| OKE | -4.72 | |
| MPC | -4.87 | |
| CVX | -5.15 | |
| PSX | -5.41 | |
| XOM | -5.86 | |
| EOG | -5.95 | |
| COP | -7.25 |
📊 Energy Stocks Performance One Month
| Stock | Performance (%) | Performance |
|---|---|---|
| MPC | -3.05 | |
| PSX | -4.14 | |
| SLB | -6.92 | |
| KMI | -6.94 | |
| EOG | -7.60 | |
| OKE | -7.82 | |
| WMB | -8.10 | |
| CVX | -8.23 | |
| COP | -10.82 | |
| XOM | -11.94 |
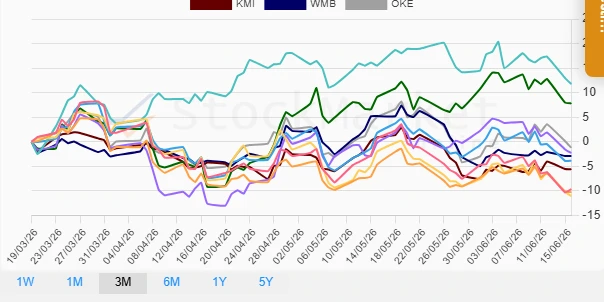
📊 Energy Stocks Performance Three Months
| Stock | Performance (%) | Performance |
|---|---|---|
| SLB | 11.78 | |
| MPC | 7.81 | |
| OKE | -1.19 | |
| PSX | -2.29 | |
| WMB | -2.91 | |
| EOG | -3.85 | |
| KMI | -5.60 | |
| XOM | -9.66 | |
| CVX | -10.26 | |
| COP | -11.06 |
📊 Summary
In conclusion, the energy sector has evidenced substantial variances in stock performance over the examined timeframes. Notably, "SLB" and "MPC" emerged as standout performers over the three-month period, contrasting a sector otherwise characterized by declines. These trends reflect broader economic influences, yet identify potential investment opportunities within resilient stocks. Investors should remain vigilant, embracing strategic adjustments as market dynamics evolve.
Smart Data Insight
Master the Perfect Entry & Exit for this Stock
Don't leave your profits to chance. Historically, this stock follows specific seasonal patterns that institutional traders use to maximize returns.
- ✅ Identify the "Golden Buying Window"
- ✅ Avoid high-risk correction cycles
- ✅ Backtested data from the last 20+ years