
September 16, 2026 a 09:32 am


Energy Stocks - Performance Analysis
The energy sector has shown significant volatility in recent periods, influenced by geopolitical factors and fluctuating commodity prices. Analyzing the performance of leading stocks over 1-week, 1-month, and 3-month periods provides valuable insights into increasing or declining trends. This report identifies key outperformers and underperformers as well as critical market trends within the sector.
📊 Energy Stocks Performance One Week
During the last week, EOG topped the charts with a performance of 4.54%, closely followed by COP and XOM. In contrast, SLB and WMB experienced the largest declines. This period reflects a varied performance with mixed sentiments across the sector.
| Stock | Performance (%) | Performance |
|---|---|---|
| EOG | 4.54 | |
| COP | 3.43 | |
| XOM | 3.09 | |
| MPC | 2.89 | |
| CVX | 1.88 | |
| PSX | 1.63 | |
| OKE | -1.12 | |
| KMI | -2.04 | |
| WMB | -4.74 | |
| SLB | -4.97 |
📈 Energy Stocks Performance One Month
MPC recorded an exceptional performance in the past month with a gain of 13.96%. Conversely, KMI faced the biggest decline. The performance distribution suggests a shift towards growth for select stocks while others face downward pressure.
| Stock | Performance (%) | Performance |
|---|---|---|
| MPC | 13.96 | |
| COP | 10.38 | |
| PSX | 9.85 | |
| CVX | 7.33 | |
| EOG | 5.27 | |
| XOM | 4.98 | |
| SLB | 1.18 | |
| OKE | -0.42 | |
| WMB | -2.20 | |
| KMI | -4.71 |
📉 Energy Stocks Performance Three Months
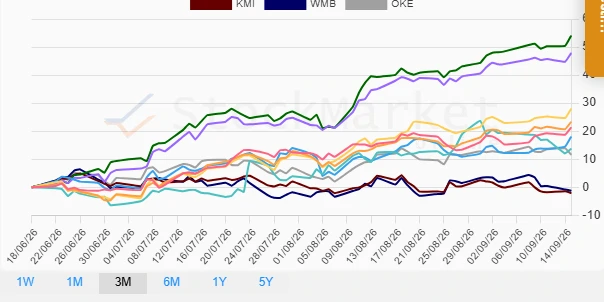
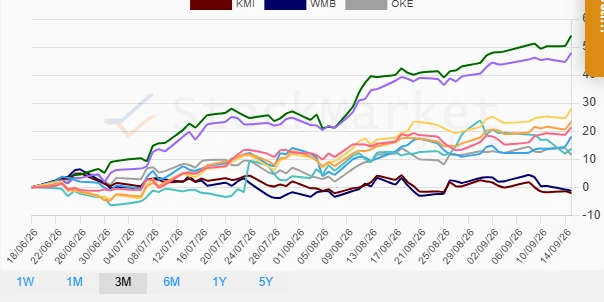
Over the past three months, MPC and PSX significantly outpaced peers, gaining 54.06% and 47.85%, respectively. KMI and WMB faced marginal declines, indicating resilience against sector headwinds. High volatility persists, as seen in divergent three-month returns.
| Stock | Performance (%) | Performance |
|---|---|---|
| MPC | 54.06 | |
| PSX | 47.85 | |
| COP | 28.04 | |
| CVX | 23.37 | |
| XOM | 21.34 | |
| EOG | 18.04 | |
| SLB | 13.73 | |
| OKE | 11.61 | |
| WMB | -1.20 | |
| KMI | -2.04 |
✅ Summary
The energy sector remains a dynamic and challenging environment, with variabilities influenced by external geopolitical tensions and intrinsic market fluctuations. MPC and PSX lead the sector with substantial gains over three months, highlighting potential investment opportunities. Meanwhile, stocks like KMI and WMB call for cautious consideration due to their recent underperformance. Investors should keep an eye on sectorial shifts and remain prepared for continued volatility.
Smart Data Insight
Master the Perfect Entry & Exit for this Stock
Don't leave your profits to chance. Historically, this stock follows specific seasonal patterns that institutional traders use to maximize returns.
- ✅ Identify the "Golden Buying Window"
- ✅ Avoid high-risk correction cycles
- ✅ Backtested data from the last 20+ years