
July 16, 2025 a 09:32 am


Energy Stocks - Performance Analysis
Hello investors, this analysis delves into the performance of major stocks within the energy sector over the past week, month, and quarter. The energy sector remains a volatile space, reflecting both market conditions and geopolitical events. With this analysis, I aim to provide insights into which stocks have outperformed and which have lagged, offering a comprehensive understanding of recent trends and potential future movements.
📊 Energy Stocks Performance One Week
The past week's performance shows a mixed bag for energy stocks. Notably, stocks like KMI and WMB saw positive gains, while others like SLB and COP experienced notable drops. The sector seems to be responding to external pressures, possibly geopolitical or demand-related.
| Stock | Performance (%) | Performance |
|---|---|---|
| WMB | 0.92 | |
| KMI | 0.52 | |
| XOM | -0.77 | |
| OKE | -1.49 | |
| CVX | -1.50 | |
| PSX | -1.64 | |
| EOG | -1.77 | |
| MPC | -2.01 | |
| COP | -2.09 | |
| SLB | -3.20 |
📊 Energy Stocks Performance One Month
Over the course of a month, energy stocks have generally shown upward trends, with MPC leading the pack with significant gains. PSX and CVX also saw strong performances, suggesting sector rotation or positive macro trends for these entities.
| Stock | Performance (%) | Performance |
|---|---|---|
| MPC | 5.35 | |
| PSX | 3.96 | |
| CVX | 3.36 | |
| KMI | 1.16 | |
| XOM | 0.61 | |
| WMB | -0.95 | |
| SLB | -1.82 | |
| COP | -2.32 | |
| EOG | -2.61 | |
| OKE | -2.56 |
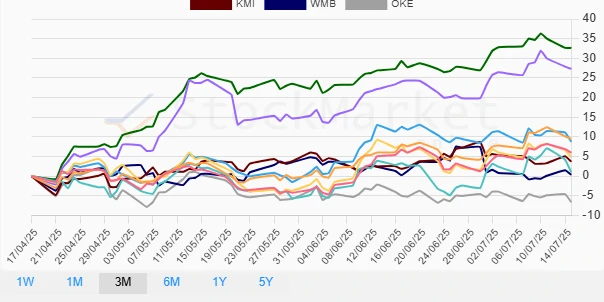
📊 Energy Stocks Performance Three Months
Over three months, we've seen impressive gains, particularly for MPC and PSX, hinting at strong market positioning or operational efficiencies. Some stocks like OKE have underperformed, suggesting potential sector headwinds specifically affecting these companies.
| Stock | Performance (%) | Performance |
|---|---|---|
| MPC | 32.65 | |
| PSX | 27.32 | |
| CVX | 9.47 | |
| EOG | 8.74 | |
| XOM | 5.98 | |
| COP | 4.92 | |
| KMI | 3.70 | |
| SLB | 1.01 | |
| WMB | 0.37 | |
| OKE | -6.59 |
Summary
The energy sector's recent performance reveals a nuanced picture. MPC emerged as a consistent top performer across all periods, signaling robust business operations or strategic market advantages. Conversely, OKE's decline warrants caution, possibly an indicator of systematic vulnerabilities or sector-specific challenges. Investors should closely monitor these trends, aligning portfolios to both capitalize on growth opportunities and mitigate downside risks.
Smart Data Insight
Master the Perfect Entry & Exit for this Stock
Don't leave your profits to chance. Historically, this stock follows specific seasonal patterns that institutional traders use to maximize returns.
- ✅ Identify the "Golden Buying Window"
- ✅ Avoid high-risk correction cycles
- ✅ Backtested data from the last 20+ years