May 14, 2025 a 09:32 am


Energy Stocks - Performance Analysis 📊
The energy sector has demonstrated notable variability in its recent market performance across varying timeframes. While some stocks exhibit robust upward trends, others portray emerging challenges. This analysis seeks to elucidate prevailing trends and provide insights into the sector's performance.
Energy Stocks Performance One Week 📈
| Stock | Performance (%) | Performance |
|---|---|---|
| PSX | 17.84 | |
| MPC | 12.03 | |
| EOG | 7.82 | |
| SLB | 7.61 | |
| OKE | 7.61 | |
| COP | 7.22 | |
| CVX | 4.76 | |
| XOM | 4.56 | |
| KMI | -0.40 | |
| WMB | -1.41 |
Energy Stocks Performance One Month 📈
| Stock | Performance (%) | Performance |
|---|---|---|
| MPC | 27.04 | |
| PSX | 25.73 | |
| COP | 8.95 | |
| EOG | 8.27 | |
| SLB | 6.60 | |
| XOM | 5.90 | |
| CVX | 5.29 | |
| OKE | 4.35 | |
| KMI | 2.95 | |
| WMB | 1.56 |
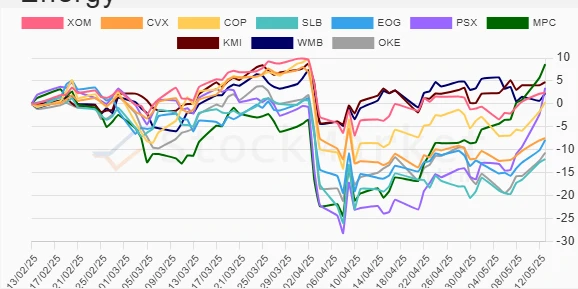
Energy Stocks Performance Three Months 📉
| Stock | Performance (%) | Performance |
|---|---|---|
| MPC | 8.64 | |
| KMI | 4.74 | |
| PSX | 3.45 | |
| XOM | 2.47 | |
| WMB | 2.30 | |
| COP | 0.34 | |
| CVX | -7.47 | |
| EOG | -7.88 | |
| OKE | -10.67 | |
| SLB | -12.07 |
Summary 🔍
Overall, energy stocks have exhibited a diverse range of performances across the analyzed timeframes. PSX and MPC are standout performers both one week and one month perspectives. Comparatively, over three months, many stocks within the sector experienced downtrends, notably SLB and OKE. It is crucial for investors to consider this volatility when making future investment decisions in the energy market. 💡
Smart Data Insight
Master the Perfect Entry & Exit for this Stock
Don't leave your profits to chance. Historically, this stock follows specific seasonal patterns that institutional traders use to maximize returns.
- ✅ Identify the "Golden Buying Window"
- ✅ Avoid high-risk correction cycles
- ✅ Backtested data from the last 20+ years