
January 14, 2026 a 09:32 am


Energy Stocks - Performance Analysis
The energy sector has shown diverse performance trends over varying time periods, showcasing sectorspecific dynamics. This analysis delves into short-term (1 week), medium-term (1 month), and long-term (3 months) performances, highlighting both opportunities and risks. We investigate top gainers, identify laggards, and provide insights into potential future trajectories within the energy landscape.
📊 Energy Stocks Performance One Week
| Stock | Performance (%) | Performance |
|---|---|---|
| SLB | 8.14% | |
| XOM | 6.66% | |
| CVX | 5.49% | |
| EOG | 5.29% | |
| OKE | 4.93% | |
| COP | 2.81% | |
| MPC | 1.95% | |
| KMI | 1.42% | |
| WMB | 0.20% | |
| PSX | 0.01% |
📊 Energy Stocks Performance One Month
| Stock | Performance (%) | Performance |
|---|---|---|
| SLB | 17.34% | |
| CVX | 9.35% | |
| XOM | 7.48% | |
| COP | 2.82% | |
| KMI | 2.61% | |
| OKE | 2.19% | |
| WMB | 1.82% | |
| EOG | 2.26% | |
| PSX | -2.02% | |
| MPC | -4.87% |
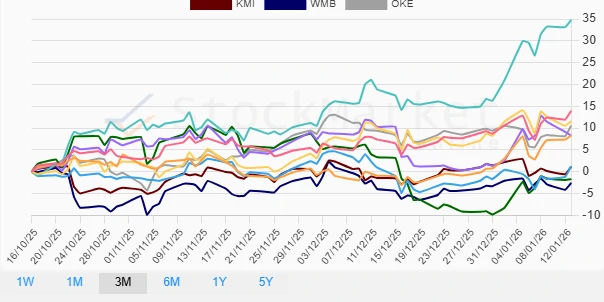
📊 Energy Stocks Performance Three Months
| Stock | Performance (%) | Performance |
|---|---|---|
| SLB | 34.80% | |
| XOM | 13.96% | |
| COP | 11.55% | |
| OKE | 10.57% | |
| CVX | 8.31% | |
| PSX | 8.29% | |
| EOG | 1.28% | |
| KMI | 1.14% | |
| MPC | -1.71% | |
| WMB | -2.58% |
📊 Summary
The analysis across varying time frames highlights that SLB has been the most robust performer, particularly over the short and long terms. Energy market volatility, reflected in stocks like MPC and WMB, necessitates careful strategy and attention to macroeconomic factors. Continued monitoring and sector-specific evaluation will be crucial for making informed investment decisions in this sector. Investors should remain vigilant, utilizing detailed performance insights to balance risk and opportunity effectively.
Smart Data Insight
Master the Perfect Entry & Exit for this Stock
Don't leave your profits to chance. Historically, this stock follows specific seasonal patterns that institutional traders use to maximize returns.
- ✅ Identify the "Golden Buying Window"
- ✅ Avoid high-risk correction cycles
- ✅ Backtested data from the last 20+ years