May 13, 2026 a 09:32 am


Energy Stocks - Performance Analysis
📊 The energy sector has demonstrated mixed performances in recent weeks, with fluctuations that highlight the volatility within this asset class. Short-term trends have revealed both opportunities and risks, and understanding these patterns is crucial for informed investment decisions. This report delves into the weekly, monthly, and quarterly performances to equip investors with critical insights.
Energy Stocks Performance One Week
🔍 Over the past week, energy stocks have shown varying levels of performance, with OKE emerging as the top performer with a remarkable 3.31% gain. Meanwhile, COP faced a setback, declining by 0.77%. It's clear that this sector remains dynamic, influenced by short-term market catalysts.
| Stock | Performance (%) | Performance |
|---|---|---|
| OKE | 3.31% | |
| KMI | 2.75% | |
| MPC | 2.57% | |
| PSX | 2.19% | |
| SLB | 1.00% | |
| XOM | 1.37% | |
| WMB | 1.37% | |
| EOG | -0.34% | |
| COP | -0.77% | |
| CVX | 0.45% |
Energy Stocks Performance One Month
🔍 The one-month performance has been notably positive, especially for MPC, which achieved an 11.91% increase, while PSX also secured significant gains with a 9.50% rise. SLB has seen a 7.27% uptick, highlighting a positive market sentiment. However, COP underperformed, losing 4.16%.
| Stock | Performance (%) | Performance |
|---|---|---|
| MPC | 11.91% | |
| PSX | 9.50% | |
| SLB | 7.27% | |
| WMB | 4.60% | |
| OKE | 3.95% | |
| KMI | 1.38% | |
| XOM | -0.98% | |
| EOG | -1.66% | |
| CVX | -2.81% | |
| COP | -4.16% |
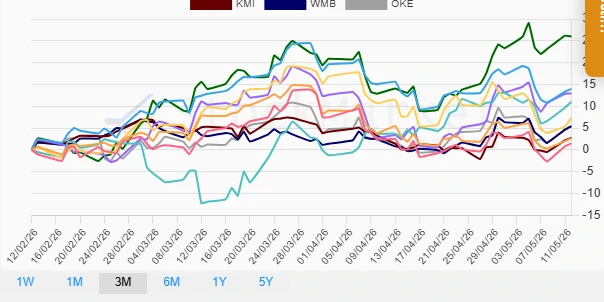
Energy Stocks Performance Three Months
🔍 Over a three-month period, MPC stands out with a staggering 26% growth, reflecting strong positioning in the market. EOG and PSX also posted significant gains, underscoring a robust growth trajectory within this timeframe. All listed stocks demonstrated gains, suggesting a favorable trend for the energy sector over the quarter.
| Stock | Performance (%) | Performance |
|---|---|---|
| MPC | 26.00% | |
| EOG | 13.98% | |
| PSX | 12.92% | |
| SLB | 11.00% | |
| COP | 7.38% | |
| OKE | 5.46% | |
| WMB | 5.41% | |
| KMI | 2.80% | |
| CVX | 2.68% | |
| XOM | 1.49% |
Summary
🗣️ The energy sector's performance over the various time horizons reveals a sector that is adjusting to market dynamics, with both ups and downs in stock prices. Over the week, OKE exhibited strong short-term gains, while the one-month analysis highlighted MPC's dominant performance. A three-month evaluation further reinforced MPC's resilience, showcasing its potential as a key player in the sector. Investors may consider these insights to assess potential investment opportunities or risks within the energy market landscape.
Smart Data Insight
Master the Perfect Entry & Exit for this Stock
Don't leave your profits to chance. Historically, this stock follows specific seasonal patterns that institutional traders use to maximize returns.
- ✅ Identify the "Golden Buying Window"
- ✅ Avoid high-risk correction cycles
- ✅ Backtested data from the last 20+ years