
August 12, 2026 a 09:32 am


Energy Stocks - Performance Analysis
Recent market trends have shown a significant fluctuation in the energy sector, reflecting both global economic pressures and individual company performance dynamics. Over the past three months, select energy stocks have demonstrated robust performance, while others have struggled under various pressures. This analysis will delve into the details, highlighting top performers and underachievers within the specified periods. 📊 Let's explore the energy sector's intricate landscape.
Energy Stocks Performance One Week
| Stock | Performance (%) | Performance |
|---|---|---|
| MPC | 12.60% | |
| PSX | 10.48% | |
| COP | 9.19% | |
| SLB | 7.49% | |
| EOG | 6.78% | |
| CVX | 5.48% | |
| XOM | 5.38% | |
| OKE | 4.92% | |
| KMI | 1.18% | |
| WMB | 0.73% |
Energy Stocks Performance One Month
| Stock | Performance (%) | Performance |
|---|---|---|
| SLB | 13.50% | |
| PSX | 12.82% | |
| MPC | 13.26% | |
| COP | 11.37% | |
| XOM | 10.34% | |
| CVX | 7.94% | |
| EOG | 3.37% | |
| OKE | -0.40% | |
| KMI | -2.21% | |
| WMB | -2.67% |
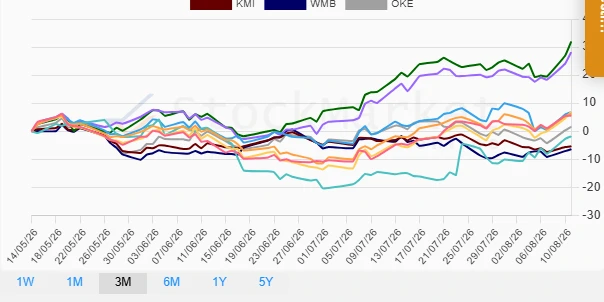
Energy Stocks Performance Three Months
| Stock | Performance (%) | Performance |
|---|---|---|
| MPC | 31.92% | |
| PSX | 28.14% | |
| COP | 6.88% | |
| EOG | 6.78% | |
| CVX | 6.17% | |
| XOM | 5.49% | |
| OKE | 1.59% | |
| SLB | -1.85% | |
| KMI | -5.36% | |
| WMB | -6.45% |
Summary
🔍 Over the examined periods, Marathon Petroleum Corporation (MPC) consistently outperformed its industry peers, leading the charge with impressive double-digit growth in both the one-month and three-month analyses. Phillips 66 (PSX) also showcased significant gains, underscoring the continued strength in refining operations. On the downside, stocks like Williams Companies (WMB) and Kinder Morgan (KMI) faced challenges, perhaps indicative of broader midstream logistical pressures. In conclusion, selective investment in thriving subsectors of the energy market could yield lucrative returns as these stocks continue to navigate through market ebbs and flows. 💡 Investors should remain vigilant, assessing both macroeconomic factors and company-specific fundamentals. ⚠️
Smart Data Insight
Master the Perfect Entry & Exit for this Stock
Don't leave your profits to chance. Historically, this stock follows specific seasonal patterns that institutional traders use to maximize returns.
- ✅ Identify the "Golden Buying Window"
- ✅ Avoid high-risk correction cycles
- ✅ Backtested data from the last 20+ years