
November 11, 2026 a 09:31 am


Energy Stocks - Performance Analysis
In the ever-evolving landscape of the energy sector, stock performance provides critical insights into market sentiments and the potential trajectory of this essential industry. With varying forces such as geopolitical tensions, regulatory shifts, and technological advancements impacting energy stocks, this analysis delves into the recent performance across different timeframes. Here, we assess the gains and losses, identify top performers, and consider strategic recommendations moving forward.
Energy Stocks Performance One Week
📊 During the past week, energy sector stocks experienced a mixed performance, heavily influenced by market volatility. EOG Resources led the group with a remarkable 3.03% increase, while Phillips 66 experienced the steepest decline at -3.33%. This divergence underlines the heterogeneous nature of the sector, bolstering the argument for a diversified investment approach.
| Stock | Performance (%) | Performance |
|---|---|---|
| EOG | 3.03% | |
| MPC | -0.60% | |
| WMB | -0.36% | |
| KMI | -0.91% | |
| COP | -0.97% | |
| OKE | -1.33% | |
| CVX | -2.66% | |
| XOM | -2.86% | |
| SLB | -3.19% | |
| PSX | -3.33% |
Energy Stocks Performance One Month
📊 Over the past month, Marathon Petroleum Corporation faced significant pressure, with a staggering -15.23% drop, marking the lowest performer. In contrast, Schlumberger posted a 2.80% increase, bubbling as a beacon of resilience within the energy stocks landscape. This stark contrast highlights the sector's vulnerability amid economic shifts and investor sentiment.
| Stock | Performance (%) | Performance |
|---|---|---|
| SLB | 2.80% | |
| EOG | 1.15% | |
| COP | -0.94% | |
| CVX | -1.47% | |
| XOM | -4.20% | |
| OKE | -4.80% | |
| KMI | -5.41% | |
| WMB | -8.55% | |
| PSX | -10.73% | |
| MPC | -15.23% |
Energy Stocks Performance Three Months
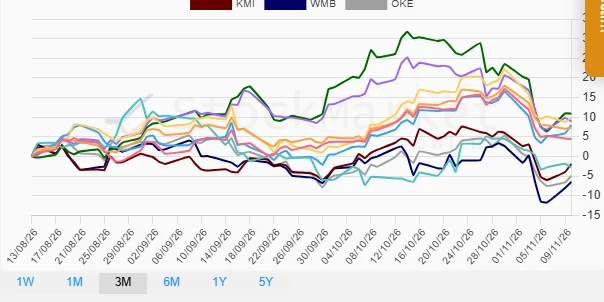
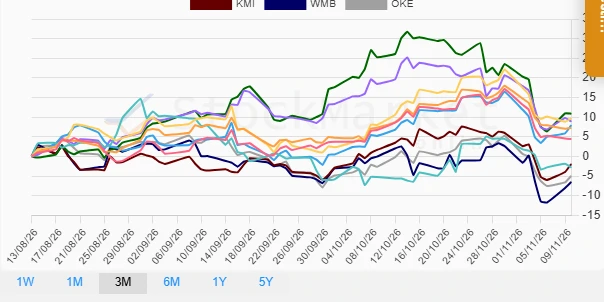
📊 Over the three-month horizon, Marathon Petroleum emerged as the top performer, boasting a 10.89% increase, while Williams Companies faced a notable downturn of -6.51%. Within this period, the variance in energy stock performance underscores both the opportunities and challenges investors face in timing their exposure to the energy sector.
| Stock | Performance (%) | Performance |
|---|---|---|
| MPC | 10.89% | |
| COP | 9.68% | |
| PSX | 8.91% | |
| EOG | 7.97% | |
| CVX | 7.28% | |
| XOM | 4.44% | |
| KMI | -1.92% | |
| SLB | -2.81% | |
| OKE | -4.97% | |
| WMB | -6.51% |
Summary
🔍 The analysis across these timeframes reveals the inherent volatility within energy stocks driven by external economic factors and internal corporate dynamics. While some stocks have shown resilience, others have demonstrated susceptibility to market pressures. For investors, maintaining an adaptable strategy with a focus on long-term potentials can balance the short-term fluctuations evident in this sector. Ultimately, diversification remains a prudent approach for mitigating risks associated with such dynamic market conditions.
Smart Data Insight
Master the Perfect Entry & Exit for this Stock
Don't leave your profits to chance. Historically, this stock follows specific seasonal patterns that institutional traders use to maximize returns.
- ✅ Identify the "Golden Buying Window"
- ✅ Avoid high-risk correction cycles
- ✅ Backtested data from the last 20+ years