
March 11, 2026 a 09:32 am


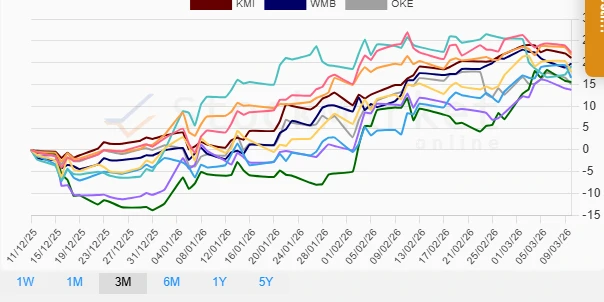

Energy Stocks - Performance Analysis
The energy sector has experienced mixed performance across different time frames, illustrating the volatility inherent in this sector. Recent data suggests a divergence in stock performance over one week, one month, and three months, reflecting both market sentiments and sector-specific challenges and opportunities. This report delineates the performance analysis for major energy stocks, identifying top performers and laggards across these periods.
Energy Stocks Performance One Week
📊 Over the past week, energy stocks exhibited a mix of marginal gains and notable declines. SLB emerged as a modest leader with a 0.50% gain, suggesting market optimism about its potential. Conversely, KMI faced the steepest decline at -2.84%, reflecting potential investor concerns.
| Stock | Performance (%) | Performance |
|---|---|---|
| SLB | 0.50 | |
| CVX | 0.18 | |
| EOG | 0.13 | |
| OKE | -0.07 | |
| XOM | -1.12 | |
| COP | -1.27 | |
| PSX | -1.34 | |
| MPC | -2.48 | |
| WMB | -2.56 | |
| KMI | -2.84 |
Energy Stocks Performance One Month
📉 In the last month, energy stocks have witnessed a robust resurgence, with EOG leading with an impressive 11.98% increase. WMB and KMI also displayed strong growth trajectories. SLB, however, recorded a significant downturn at -4.61%, warranting attention from risk-averse investors.
| Stock | Performance (%) | Performance |
|---|---|---|
| EOG | 11.98 | |
| WMB | 8.59 | |
| KMI | 6.24 | |
| MPC | 5.87 | |
| COP | 5.21 | |
| PSX | 3.41 | |
| OKE | 2.18 | |
| CVX | 2.13 | |
| XOM | -1.74 | |
| SLB | -4.61 |
Energy Stocks Performance Three Months
📈 Over the past three months, the energy sector has experienced robust growth. XOM leads with a remarkable 22.35% rally, closely followed by CVX and KMI. This trend underscores a sector-wide momentum shift, likely influenced by macroeconomic factors such as oil prices and global energy demand forecasts.
| Stock | Performance (%) | Performance |
|---|---|---|
| XOM | 22.35 | |
| CVX | 21.87 | |
| KMI | 21.10 | |
| WMB | 19.78 | |
| SLB | 19.22 | |
| COP | 17.87 | |
| EOG | 16.54 | |
| MPC | 15.59 | |
| PSX | 13.79 | |
| OKE | 15.07 |
Summary
💡 In summary, the energy sector has shown resilience over the three-month period with most stocks posting substantial gains, driven potentially by a combination of favorable economic conditions and strategic industry developments. Short-term fluctuations seen over the past week provide a reminder of the sector's inherent volatility. Investors should continue to monitor macroeconomic indicators and industry trends to navigate this dynamic environment effectively.
Smart Data Insight
Master the Perfect Entry & Exit for this Stock
Don't leave your profits to chance. Historically, this stock follows specific seasonal patterns that institutional traders use to maximize returns.
- ✅ Identify the "Golden Buying Window"
- ✅ Avoid high-risk correction cycles
- ✅ Backtested data from the last 20+ years