
June 10, 2026 a 09:32 am


Energy Stocks - Performance Analysis
📊 The energy sector has shown varied performance over different periods, with significant fluctuations in key stocks. This analysis highlights the top-performing and underperforming stocks over the past week, month, and three months. By understanding these trends, investors can make informed decisions in a volatile market.
Energy Stocks Performance One Week
🔍 Analyzing the weekly performance, many energy stocks exhibited negative trends. Notably, OKE was the only stock to report a positive performance, albeit modest. The one-week period was challenging for the sector, indicating a possible short-term bearish sentiment.
| Stock | Performance (%) | Performance |
|---|---|---|
| OKE | 1.23% | |
| KMI | -0.08% | |
| WMB | -0.09% | |
| CVX | -1.55% | |
| SLB | -1.55% | |
| COP | -1.88% | |
| XOM | -2.36% | |
| EOG | -2.93% | |
| PSX | -3.09% | |
| MPC | -3.37% |
Energy Stocks Performance One Month
📈 Over the last month, several energy stocks have rebounded, showcasing positive momentum. SLB and EOG have emerged as the prominent leaders, while WMB struggled with the most significant decline. This period reflects a recovery phase for most stocks.
| Stock | Performance (%) | Performance |
|---|---|---|
| EOG | 3.30% | |
| MPC | 2.64% | |
| PSX | 2.32% | |
| SLB | 2.11% | |
| COP | 1.33% | |
| CVX | 1.33% | |
| OKE | 0.37% | |
| XOM | -0.19% | |
| KMI | -2.65% | |
| WMB | -3.29% |
Energy Stocks Performance Three Months
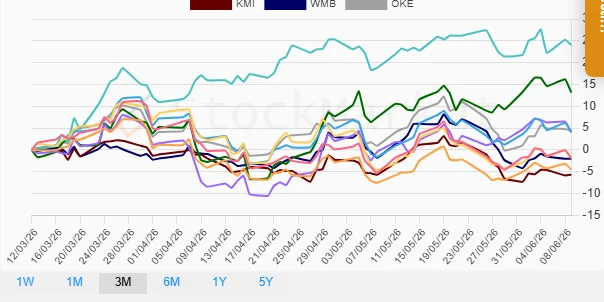
📉 The past three months showcase a significant variance in performance. SLB outperforms with a dramatic increase, while KMI underperforms significantly. This period reflects long-term sectoral adjustments and underlying market conditions affecting energy stocks.
| Stock | Performance (%) | Performance |
|---|---|---|
| SLB | 24.04% | |
| MPC | 13.20% | |
| OKE | 4.39% | |
| EOG | 4.23% | |
| PSX | 4.07% | |
| COP | -1.77% | |
| XOM | -1.96% | |
| WMB | -2.01% | |
| CVX | -4.50% | |
| KMI | -5.68% |
Summary
✅ The energy sector displays a complex performance pattern over the evaluated periods. The short-term view reveals more challenges, while longer horizons show potential resilience and growth, particularly as evidenced by SLB's prominent rise. Investors should remain attentive to these temporal differences when strategizing positions in energy stocks for maximizing returns.
Smart Data Insight
Master the Perfect Entry & Exit for this Stock
Don't leave your profits to chance. Historically, this stock follows specific seasonal patterns that institutional traders use to maximize returns.
- ✅ Identify the "Golden Buying Window"
- ✅ Avoid high-risk correction cycles
- ✅ Backtested data from the last 20+ years