
September 09, 2026 a 09:32 am


Energy Stocks - Performance Analysis
The energy sector has demonstrated diverse movements across different timeframes, reflecting the dynamic nature of market influences. By examining short, medium, and longer-term data, investors can gain insight into potential strategies. In this analysis, we will scrutinize the weekly, monthly, and quarterly performances of key energy stocks to identify patterns and prevailing trends. Stay tuned for insights that might influence both current and future trading decisions.
Energy Stocks Performance One Week
📅 Over the past week, the energy sector showed a mix of positive and negative movements among the top stocks. Some companies managed to rise, while others faced moderate declines. Notably, Marathon Petroleum (MPC) led the performance with a substantial increase, while EOG Resources (EOG) experienced the greatest decline. This diverse performance could reflect differing responses to short-term market conditions or recent announcements.
| Stock | Performance (%) | Performance |
|---|---|---|
| MPC | 2.77% | |
| PSX | 1.20% | |
| OKE | 1.58% | |
| WMB | 0.93% | |
| KMI | 0.06% | |
| CVX | -0.93% | |
| COP | -1.58% | |
| SLB | -1.78% | |
| XOM | -2.12% | |
| EOG | -2.42% |
Energy Stocks Performance One Month
📈 Over the past month, the energy sector showcased significant gains with most stocks registering positive returns. Marathon Petroleum (MPC) and Phillips 66 (PSX) were the top performers, reflecting strong growth and potential investor confidence. Slower yet consistent growth was seen across ExxonMobil (XOM) and Kinder Morgan (KMI) as well, underscoring a more stable upward trajectory within the sector.
| Stock | Performance (%) | Performance |
|---|---|---|
| MPC | 22.04% | |
| PSX | 18.75% | |
| COP | 9.55% | |
| OKE | 7.85% | |
| SLB | 7.55% | |
| CVX | 7.48% | |
| WMB | 5.73% | |
| EOG | 2.36% | |
| KMI | 2.11% | |
| XOM | 0.73% |
Energy Stocks Performance Three Months
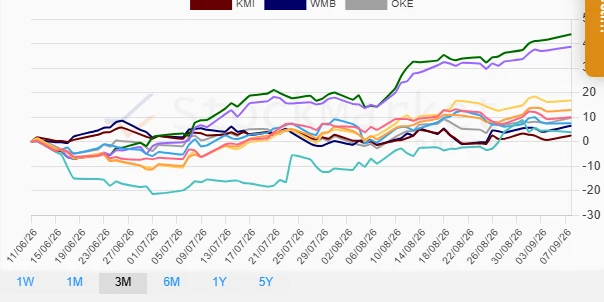
📊 Reviewing the past quarter reveals robust growth within the energy sector, with stocks generally posting high returns. Marathon Petroleum (MPC) again takes the spotlight with the most significant positive movement. Phillips 66 (PSX) follows closely with strong growth, indicating sustained investor confidence and potential market strength. ConocoPhillips (COP) and Chevron (CVX) also performed favorably, rounding off a generally upward trend in the sector over the last three months.
| Stock | Performance (%) | Performance |
|---|---|---|
| MPC | 43.79% | |
| PSX | 38.74% | |
| COP | 16.82% | |
| CVX | 12.91% | |
| XOM | 9.97% | |
| OKE | 9.76% | |
| EOG | 7.54% | |
| SLB | 3.91% | |
| WMB | 6.55% | |
| KMI | 2.55% |
Summary
🔍 In summary, the energy sector has demonstrated a generally positive trend over the reviewed timeframes, particularly notable within the monthly and quarterly periods. Marathon Petroleum (MPC) and Phillips 66 (PSX) consistently emerge as standout performers, suggesting robust operational strategies and possibly favorable market conditions for refining operations. Investors may watch these stocks closely for continued opportunities. Meanwhile, the variance in weekly performance underscores the importance of considering both short-term market volatility and long-term growth potential.
Smart Data Insight
Master the Perfect Entry & Exit for this Stock
Don't leave your profits to chance. Historically, this stock follows specific seasonal patterns that institutional traders use to maximize returns.
- ✅ Identify the "Golden Buying Window"
- ✅ Avoid high-risk correction cycles
- ✅ Backtested data from the last 20+ years