
October 07, 2026 a 09:32 am


Energy Stocks - Performance Analysis
The energy sector has experienced varying degrees of performance across its major stocks over the past one week, one month, and three-month periods. Investors have witnessed both rapid growth in certain stocks and notable declines in others. Our analysis will dissect these performance trends, highlighting the leaders and laggards, and providing insights into the current market dynamics within the energy sector.
📊 Energy Stocks Performance One Week
The past week displayed strong upward momentum across most major energy stocks. Despite the volatile macroeconomic environment, many companies in the sector have posted positive gains, likely influenced by stable oil prices and seasonal demand increases. Notably, Marathon Petroleum (MPC) led the charge with a gain of 9.15%, followed by Kinder Morgan (KMI) and Williams Companies (WMB).
| Stock | Performance (%) | Performance |
|---|---|---|
| MPC | 9.15% | |
| KMI | 6.51% | |
| WMB | 6.36% | |
| PSX | 5.59% | |
| EOG | 4.68% | |
| OKE | 4.58% | |
| COP | 3.33% | |
| SLB | 2.64% | |
| CVX | 1.65% | |
| XOM | 1.06% |
🔍 Energy Stocks Performance One Month
Over the one-month period, performance metrics illustrate a more mixed picture. Marathon Petroleum again emerged as a robust leader, with gains robust at 11.14%, contrasting with Schlumberger's downturn, which saw a significant drop of 13.63%. The volatility echoed broader market uncertainties, with a few stocks like Chevron and Williams Companies facing slight to moderate downturns.
| Stock | Performance (%) | Performance |
|---|---|---|
| MPC | 11.14% | |
| PSX | 5.92% | |
| OKE | 3.32% | |
| KMI | 2.56% | |
| XOM | 3.32% | |
| EOG | -0.26% | |
| CVX | -0.29% | |
| WMB | -2.23% | |
| COP | -3.32% | |
| OKE | -6.46% | |
| SLB | -13.63% |
📈 Energy Stocks Performance Three Months
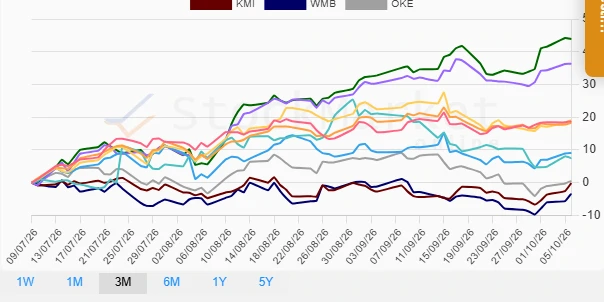
Analyzing the last three months, the energy sector has been volatile yet immensely rewarding for investors betting on certain equities. Phillips 66 (PSX) and Marathon Petroleum Corporation (MPC) were the champions, delivering outstanding returns of 36.30% and 43.92%, respectively. However, Kinder Morgan underperformed slightly in this period.
| Stock | Performance (%) | Performance |
|---|---|---|
| MPC | 43.92% | |
| PSX | 36.30% | |
| COP | 19.10% | |
| XOM | 18.71% | |
| CVX | 18.29% | |
| EOG | 9.05% | |
| SLB | 7.49% | |
| OKE | 0.49% | |
| KMI | -0.17% | |
| WMB | -3.40% |
✅ Summary
The energy sector has displayed a mixed bag of performance results across different time frames. Short-term gains have been notable in stocks like Marathon Petroleum whereas others such as Schlumberger experienced more significant volatility. Overall, this period reflects both opportunities and challenges within the energy market. Investors should remain cautious and potentially look toward stocks showing consistent growth over the medium term, while being mindful of macroeconomic factors that may affect future performances.
Smart Data Insight
Master the Perfect Entry & Exit for this Stock
Don't leave your profits to chance. Historically, this stock follows specific seasonal patterns that institutional traders use to maximize returns.
- ✅ Identify the "Golden Buying Window"
- ✅ Avoid high-risk correction cycles
- ✅ Backtested data from the last 20+ years