August 06, 2025 a 09:32 am


Energy Stocks - Performance Analysis
In the ever-volatile energy sector, stock performance can be highly unpredictable. Recent data analysis reveals significant fluctuations over weekly, monthly, and quarterly periods. This report examines energy stocks' movement in detail, highlighting both top performers and underperformers. Let's delve into the nuances of these performances and emerging trends in the energy sector market.
📊 Energy Stocks Performance One Week
| Stock | Performance (%) | Performance |
|---|---|---|
| KMI | 0.11 | |
| CVX | -0.33 | |
| WMB | -0.38 | |
| MPC | -1.05 | |
| PSX | -1.82 | |
| SLB | -1.92 | |
| EOG | -2.85 | |
| COP | -3.61 | |
| XOM | -4.21 | |
| OKE | -8.01 |
📊 Energy Stocks Performance One Month
| Stock | Performance (%) | Performance |
|---|---|---|
| CVX | 3.94 | |
| WMB | 1.08 | |
| COP | 0.96 | |
| KMI | -0.87 | |
| EOG | -1.29 | |
| PSX | -3.08 | |
| XOM | -3.36 | |
| SLB | -3.72 | |
| MPC | -4.12 | |
| OKE | -5.30 |
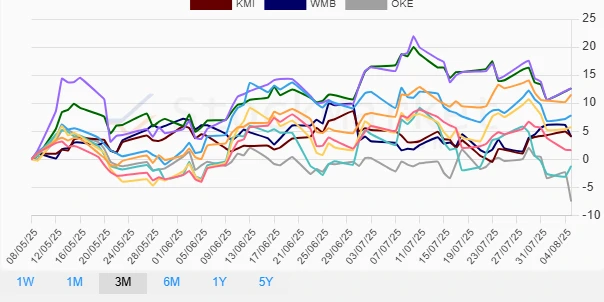
📊 Energy Stocks Performance Three Months
| Stock | Performance (%) | Performance |
|---|---|---|
| PSX | 12.64 | |
| MPC | 12.63 | |
| CVX | 11.52 | |
| EOG | 7.84 | |
| COP | 5.73 | |
| KMI | 4.08 | |
| WMB | 4.02 | |
| XOM | 1.62 | |
| SLB | -1.21 | |
| OKE | -7.48 |
📈 Summary
The analysis of energy stocks over varying time frames highlights the volatility inherent in the industry. Over one week, the sector faced negative pressures, with OKE leading the decline by a significant margin. The one-month analysis shows a mixed performance with CVX marking a notable gain, though OKE continued its underperformance. Over the three-month period, PSX and MPC displayed strong upward movements, signaling a positive trend for specific stocks amidst sectorwide challenges. Investors should consider these fluctuations when making strategic asset allocations, recognizing both the opportunities and risks present within the energy sector.
Smart Data Insight
Master the Perfect Entry & Exit for this Stock
Don't leave your profits to chance. Historically, this stock follows specific seasonal patterns that institutional traders use to maximize returns.
- ✅ Identify the "Golden Buying Window"
- ✅ Avoid high-risk correction cycles
- ✅ Backtested data from the last 20+ years