
November 04, 2026 a 09:32 am


Energy Stocks - Performance Analysis
This analysis provides a comprehensive overview of the performance of major energy sector stocks over three distinct time frames: one week, one month, and three months. We examine which stocks have shown significant movements, highlighting both top performers and those that have underperformed. This insight provides an opportunity to better understand market dynamics and trends within the energy sector.
📊 Energy Stocks Performance One Week
During the last week, the energy sector observed a general downward trend. The overall negative sentiment might reflect broader market conditions or specific sector challenges. Phillips 66 (PSX) managed to limit its losses to -0.56%, coming out as the relative top performer for this timeframe. On the other end, EOG Resources (EOG) and Schlumberger (SLB) both experienced more substantial declines, highlighting vulnerabilities in their operations or market positions.
| Stock | Performance (%) | Performance |
|---|---|---|
| PSX | -0.56 | |
| CVX | -1.65 | |
| KMI | -2.00 | |
| WMB | -2.34 | |
| XOM | -2.42 | |
| OKE | -2.67 | |
| MPC | -2.97 | |
| COP | -3.01 | |
| SLB | -3.02 | |
| EOG | -3.48 |
📊 Energy Stocks Performance One Month
For the one-month timeframe, the energy sector exhibited notable positive performance, with the exception of Marathon Petroleum Corporation (MPC), which experienced a slight decline. ConocoPhillips (COP) led the gainers with a substantial uptick of 12.18%, showcasing strong upward momentum. Such positive trends might indicate positive investor sentiment or significant corporate or market developments favoring these stocks.
| Stock | Performance (%) | Performance |
|---|---|---|
| MPC | -0.68 | |
| PSX | 1.48 | |
| WMB | 2.87 | |
| SLB | 4.14 | |
| OKE | 4.04 | |
| KMI | 4.85 | |
| EOG | 7.77 | |
| XOM | 8.18 | |
| CVX | 8.99 | |
| COP | 12.18 |
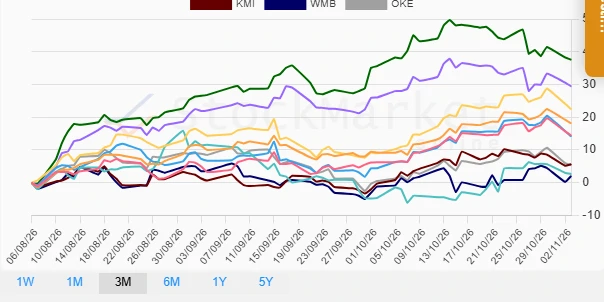
📊 Energy Stocks Performance Three Months
The three-month analysis highlights a robust growth pattern across the energy sector, with Marathon Petroleum Corporation (MPC) leading the charge with an impressive 37.55% increase. Not far behind, Phillips 66 (PSX) also marked strong performance, underscoring potential strategic and market-driven factors benefiting these stocks. Given the impressive upward momentum, these stocks might suggest opportunities for strategic investments.
| Stock | Performance (%) | Performance |
|---|---|---|
| WMB | 2.03 | |
| SLB | 2.65 | |
| OKE | 5.34 | |
| KMI | 5.66 | |
| SLB | 2.65 | |
| EOG | 14.09 | |
| XOM | 14.44 | |
| CVX | 18.13 | |
| COP | 22.43 | |
| PSX | 29.44 | |
| MPC | 37.55 |
🔍 Summary
The energy sector has shown mixed performance over various periods, with recent weeks indicating a slight downtrend. However, the medium-term view (three months) remains solidly positive, led by companies like Marathon Petroleum and Phillips 66. An investor considering this sector should account for both the volatility in short-term movements and the strong growth potential indicated over a longer horizon. Continuing to monitor economic and market-based news will be critical in making informed decisions in this sector.
Smart Data Insight
Master the Perfect Entry & Exit for this Stock
Don't leave your profits to chance. Historically, this stock follows specific seasonal patterns that institutional traders use to maximize returns.
- ✅ Identify the "Golden Buying Window"
- ✅ Avoid high-risk correction cycles
- ✅ Backtested data from the last 20+ years