
July 01, 2026 a 09:32 am


Energy Stocks - Performance Analysis
In a rapidly evolving economic landscape, energy stocks present a volatile but compelling investment opportunity. This analysis delves into the performance of major energy stocks over various time frames, identifying potential trends and market sentiments that could influence future performance. 📈 The energy sector's unpredictability requires a keen eye for detail and understanding of market forces. We explore notable performances over the past week, month, and quarter.
📊 Energy Stocks Performance One Week
The past week demonstrated mixed performance within the energy sector, with Marathon Petroleum Corporation (MPC) emerging as the top performer with a notable gain of 3.72%. Conversely, EOG Resources (EOG) faced the steepest decline, dropping 3.56%. The data reflects a differential response to short-term market influences, highlighting the sector's inherent volatility.
| Stock | Performance (%) | Performance |
|---|---|---|
| MPC | 3.72 | |
| PSX | 0.32 | |
| XOM | -0.12 | |
| SLB | -0.23 | |
| OKE | -0.38 | |
| KMI | -1.86 | |
| WMB | -1.94 | |
| COP | -2.79 | |
| CVX | -3.35 | |
| EOG | -3.56 |
📊 Energy Stocks Performance One Month
Over the past month, the energy sector remained under pressure, with losses observed across most stocks. Williams Companies Inc. (WMB) showed resilience with a 6.16% increase, countering the prevailing downtrend. Schlumberger Limited (SLB) reported the largest decline at 15.66%, showcasing the ongoing challenges in the sector.
| Stock | Performance (%) | Performance |
|---|---|---|
| WMB | 6.16 | |
| KMI | 3.75 | |
| OKE | 2.60 | |
| MPC | -0.79 | |
| EOG | -4.87 | |
| PSX | -6.12 | |
| XOM | -8.59 | |
| COP | -10.19 | |
| CVX | -11.18 | |
| SLB | -15.66 |
📊 Energy Stocks Performance Three Months
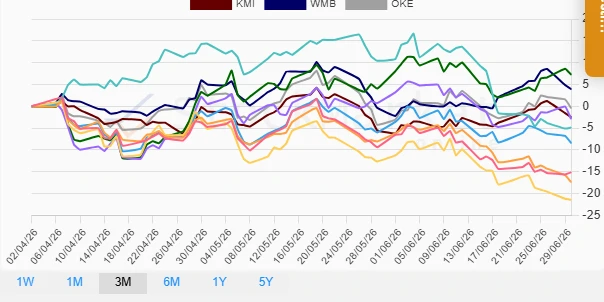
Analyzing quarterly performance reveals more pronounced trends within the energy sector. While Marathon Petroleum Corporation (MPC) surged with a 7.24% increase, ConocoPhillips (COP) experienced a significant downturn with a decline of 21.43%. This period encapsulates broader economic and industry-specific challenges faced by energy firms.
| Stock | Performance (%) | Performance |
|---|---|---|
| MPC | 7.24 | |
| WMB | 3.93 | |
| OKE | -0.44 | |
| PSX | -2.92 | |
| KMI | -2.49 | |
| SLB | -4.87 | |
| EOG | -8.44 | |
| XOM | -15.13 | |
| CVX | -17.39 | |
| COP | -21.43 |
🔍 Summary
The energy sector's recent performance highlights a challenging environment characterized by significant volatility and sector-specific pressures. Quarterly analysis underlines the divergence in stock performance, with MPC consistently outperforming other energy equities. Investors should remain cautious, maintaining a diversified portfolio to mitigate risks inherent in the sector. 📉 While short-term fluctuations are evident, long-term strategic insights are crucial for sustained investment success.
Smart Data Insight
Master the Perfect Entry & Exit for this Stock
Don't leave your profits to chance. Historically, this stock follows specific seasonal patterns that institutional traders use to maximize returns.
- ✅ Identify the "Golden Buying Window"
- ✅ Avoid high-risk correction cycles
- ✅ Backtested data from the last 20+ years