January 09, 2026 a 02:04 pm
EXR: Trend and Support & Resistance Analysis - Extra Space Storage Inc.
Extra Space Storage Inc. (EXR) has experienced steady fluctuations in its stock prices. Recent data indicates a tentative rebound, with signs of stronger buying interest. However, market volatility remains a factor, and investors should stay cautious while considering the potential for growth.
Trend Analysis
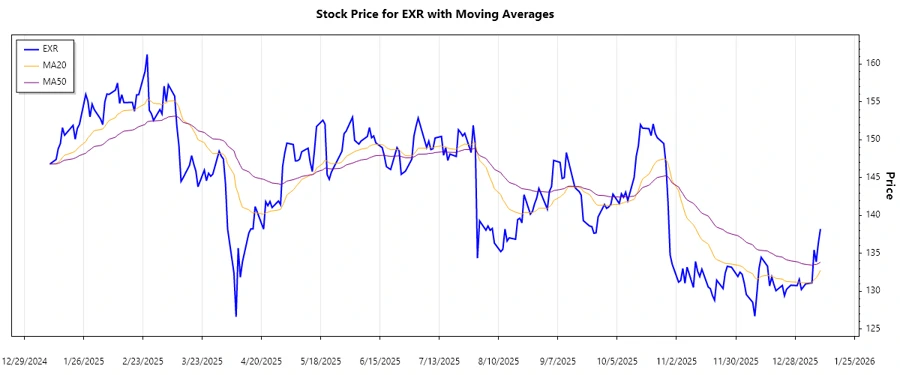
The analysis considers the closing prices of the last several months, calculating the EMA20 and EMA50 to evaluate the trend direction. As of the latest data, the EMA20 is below the EMA50, indicating a potential ▲ upward trend. The recent price action suggests some renewed investor interest as the stock attempts a recovery from previous lows.
| Date | Closing Price | Trend |
|---|---|---|
| 2026-01-09 | 138.22 | ▲ |
| 2026-01-08 | 136.35 | ▲ |
| 2026-01-07 | 133.88 | ▲ |
| 2026-01-06 | 135.46 | ▲ |
| 2026-01-05 | 131.10 | ▲ |
| 2026-01-02 | 130.97 | ▲ |
| 2025-12-31 | 130.22 | ▲ |
In conclusion, the current EMA analysis supports a cautious optimism for upward movement, though volatility is still a concern.
Support and Resistance
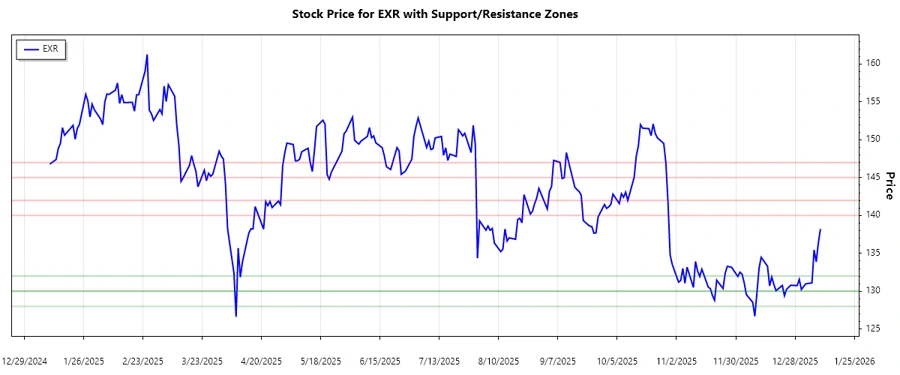
The technical analysis has identified critical support and resistance zones for EXR based on recent price movements. The two identified support zones and resistance zones are key to understanding potential breakout or breakdown scenarios.
| Zone Type | From | To |
|---|---|---|
| Support | 130 | 132 |
| Support | 128 | 130 |
| Resistance | 140 | 142 |
| Resistance | 145 | 147 |
The current price is approaching the upper boundary of the first support zone, which could signify a potential rebound.
Conclusion
As EXR navigates through a challenging market environment, the technical indicators suggest cautious optimism. The upward trend signal, coupled with proximity to established support zones, provides potential for positive movement. However, persistent volatility demands careful risk management and monitoring. The upcoming financial developments and broader market signals will be crucial in determining the stock's direction. Investors are advised to stay informed and ready to adapt their strategies.
json This analysis takes into account historical price data and current technical indicators, delivering insights tailored for strategic decision-making in a dynamic market.