September 20, 2025 a 11:45 am
EXR: Fibonacci Analysis - Extra Space Storage Inc.
Extra Space Storage Inc. (EXR) remains a strong contender in the self-storage sector, boasting an extensive footprint across the United States. Recent trends indicate potential volatility, yet stability in the broader operational context. For investors, EXR's consistent rental income amid fluctuating economic conditions presents a strategic opportunity. Technical indicators like the Fibonacci retracement could provide insights on possible price movements. This analysis aims to determine technical levels of interest with the help of historical data.
Fibonacci Analysis
| Parameter | Details |
|---|---|
| Trend Type | Downtrend |
| Trend Start Date | 2024-09-23 |
| Trend End Date | 2025-09-19 |
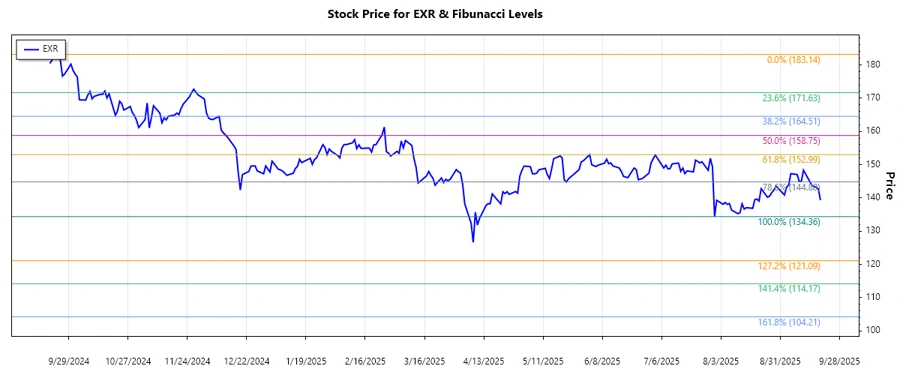
| High Point | $183.14 (2024-09-23) |
| Low Point | $134.36 (2025-07-31) |
| Fibonacci Level | Price Level |
|---|---|
| 0.236 | $145.89 |
| 0.382 | $153.61 |
| 0.5 | $158.75 |
| 0.618 | $163.89 |
| 0.786 | $171.61 |
As of the latest data, the current price of $139.32 is below the 0.236 Fibonacci retracement level, indicating it's not in the expected retracement zone. Such a position could imply that the stock is experiencing continued pressure, with the potential for further declines unless supported by new demand.
Conclusion
The analysis of Extra Space Storage Inc. (EXR) shows a significant downtrend over the reviewed period, marked by a high of $183.14 and a low of $134.36. The current price suggests that EXR is under selling pressure as it remains below key Fibonacci retracement levels. This positioning could present an investment risk; however, it also enables opportunities once signs of a reversal become evident. The broader outlook may hinge on operational performance and market sentiment in the self-storage sector. Analysts should remain vigilant for any breakouts above the critical Fibonacci levels, as they could serve as indicators of trend reversals or continuation.
Smart Data Insight
Master the Perfect Entry & Exit for this Stock
Don't leave your profits to chance. Historically, this stock follows specific seasonal patterns that institutional traders use to maximize returns.
- ✅ Identify the "Golden Buying Window"
- ✅ Avoid high-risk correction cycles
- ✅ Backtested data from the last 20+ years