May 14, 2026 a 07:31 am


EXR: Dividend Analysis - Extra Space Storage Inc.
Extra Space Storage Inc. showcases a strong dividend history with stable growth patterns, critical for investors seeking consistent income streams. The company's dividend yield coupled with its growth rate presents a promising investment opportunity amidst the competitive REIT sector. However, elevated payout ratios warrant close scrutiny, suggesting future income sustainability assessments are necessary.
Overview 📊
Extra Space Storage Inc. operates within the Real Estate Investment Trust (REIT) sector. With a robust dividend yield of 4.65%, the company offers a substantial return on investment through dividends. The current dividend per share stands at $6.49 USD, backed by a strong 23-year dividend history. Notably, there has been no recent dividend cut or suspension.
| Detail | Value |
|---|---|
| Sector | Real Estate |
| Dividend yield | 4.65 % |
| Current dividend per share | 6.49 USD |
| Dividend history | 23 years |
| Last cut or suspension | None |
Dividend History 📉
Analyzing historical dividend payments is imperative as it reflects the company's commitment to returning value to shareholders over time. A consistent dividend history often equates to reduced investment risk.
| Year | Dividend per Share (USD) |
|---|---|
| 2026 | 1.62 |
| 2025 | 6.48 |
| 2024 | 6.48 |
| 2023 | 6.48 |
| 2022 | 6.00 |
Dividend Growth 📈
Tracking dividend growth provides insights into a company's capability to enhance shareholder value over time. The growth rates indicate the sustainability and prospect of increased future payouts.
| Time | Growth |
|---|---|
| 3 years | 2.60 % |
| 5 years | 12.47 % |
The average dividend growth is 12.47 % over 5 years. This shows moderate but steady dividend growth.
Payout Ratio ⚖️
The payout ratio is a vital metric assessing how comfortably earnings and free cash flow support dividend payments. Elevated ratios could indicate potential unsustainability.
| Key figure | Ratio |
|---|---|
| EPS-based | 144.91 % |
| Free cash flow-based | 78.15 % |
With a payout ratio of 144.91 % based on EPS, dividends currently exceed earnings, signaling potential risk; however, the free cash flow ratio of 78.15 % remains acceptable.
Cashflow & Capital Efficiency 💰
Cash flow analysis assists in measuring operational efficiency and a company's ability to fund dividends without external debt dependencies. Higher efficiency ratios often correlate with sustainable dividend policies.
| Year | 2025 | 2024 | 2023 |
|---|---|---|---|
| Free Cash Flow Yield | 6.63% | 5.90% | 5.11% |
| Earnings Yield | 3.53% | 2.70% | 2.96% |
| CAPEX to Operating Cash Flow | 1.14% | 1.09% | 1.14% |
| Stock-based Compensation to Revenue | 1.05% | 0.69% | 1.02% |
| Free Cash Flow / Operating Cash Flow Ratio | 98.86% | 98.91% | 98.86% |
The stable free cash flow and capital efficiency indicate a solid operational footing capable of supporting consistent dividends.
Balance Sheet & Leverage Analysis 📈
The balance sheet offers insights into a firm's financial health and risk by illustrating debt levels relative to assets and equity, and the ability to cover liabilities.
| Year | 2025 | 2024 | 2023 |
|---|---|---|---|
| Debt-to-Equity | 1.11 | 0.93 | 0.78 |
| Debt-to-Assets | 51.16% | 45.16% | 40.99% |
| Debt-to-Capital | 52.71% | 48.30% | 43.88% |
| Net Debt to EBITDA | 5.14 | 5.70 | 6.22 |
| Current Ratio | 1.28 | 0.93 | 0.85 |
| Quick Ratio | 1.28 | 0.93 | 0.85 |
| Financial Leverage | 2.18 | 2.07 | 1.91 |
Although leverage ratios are high, particularly the net debt to EBITDA, stability in other areas provides confidence in their financial position.
Fundamental Strength & Profitability ✅
Profitability metrics are key indicators of how effectively a company uses its resources to generate earnings, which directly influences its capacity to maintain or increase dividends.
| Year | 2025 | 2024 | 2023 |
|---|---|---|---|
| Return on Equity | 7.25% | 6.13% | 5.58% |
| Return on Assets | 3.33% | 2.96% | 2.93% |
| Margins: Net | 28.84% | 25.60% | 30.71% |
| EBIT | 50.31% | 44.40% | 49.39% |
| EBITDA | 71.48% | 67.70% | 68.54% |
| Gross | 28.43% | 76.31% | 77.29% |
| R&D to Revenue | 0% | 0% | 0% |
The firm maintains respectable profitability, with margins and returns reinforcing its potential for long-term dividend growth and shareholder returns.
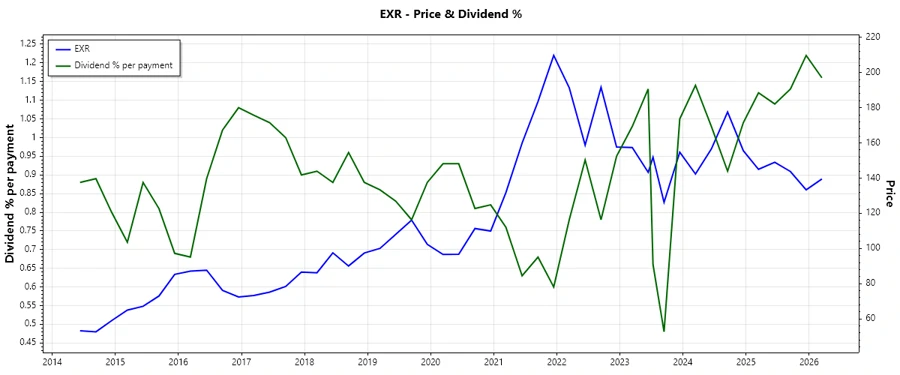
Price Development 💹
Dividend Scoring System 🗣️
| Criteria | Score | Score Bar |
|---|---|---|
| Dividend yield | 4 | |
| Dividend Stability | 5 | |
| Dividend growth | 3 | |
| Payout ratio | 2 | |
| Financial stability | 3 | |
| Dividend continuity | 5 | |
| Cashflow Coverage | 4 | |
| Balance Sheet Quality | 3 |
Total Score: 29/40
Rating ✨
Extra Space Storage Inc. offers a compelling dividend profile suitable for income-focused investors, yet the high payout ratio necessitates vigilant monitoring. The company's financial structure and profitability metrics generally favor sustained dividend payments, though vigilance in financial management remains critical to avoid over-leverage risks. Therefore, it presents a favorable opportunity with some caution advised.
Smart Data Insight
Master the Perfect Entry & Exit for this Stock
Don't leave your profits to chance. Historically, this stock follows specific seasonal patterns that institutional traders use to maximize returns.
- ✅ Identify the "Golden Buying Window"
- ✅ Avoid high-risk correction cycles
- ✅ Backtested data from the last 20+ years