March 21, 2026 a 02:46 am
EXR: Dividend Analysis - Extra Space Storage Inc.
Extra Space Storage Inc. (EXR) exhibits a robust dividend profile with a significant dividend yield and a long history of consistent dividend payments. However, the company’s high EPS payout ratio may indicate potential risks in sustaining the current dividend levels. Investors should consider the balance between income generation and payout when evaluating this stock.
📊 Overview
Extra Space Storage Inc., operating in the real estate sector, presents a promising dividend yield, making it attractive for income-focused investors. Its substantial dividend history reflects stability, though attention to the payout ratios is crucial.
| Metric | Data |
|---|---|
| Sector | Real Estate |
| Dividend yield | 4.65 % |
| Current dividend per share | 6.49 USD |
| Dividend history | 23 years |
| Last cut or suspension | None |
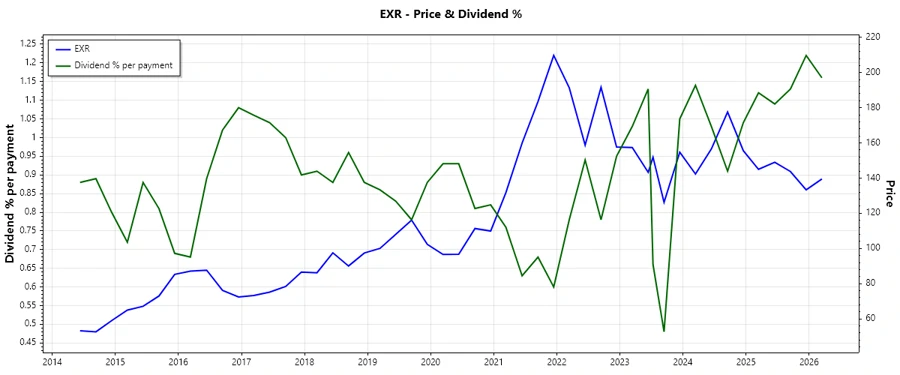
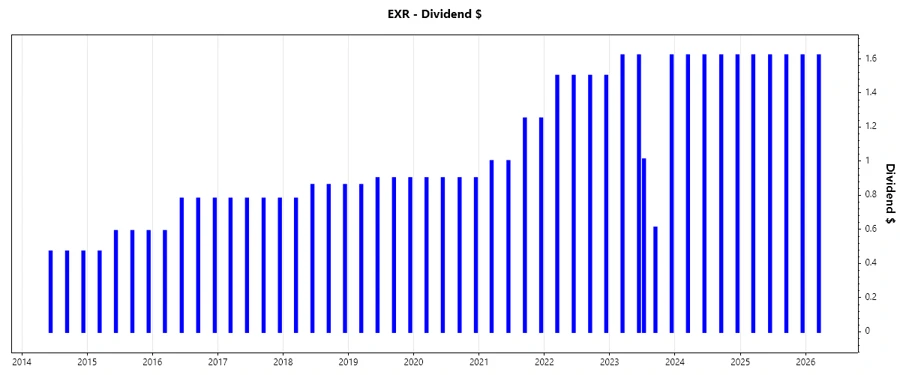
🗣️ Dividend History
Extra Space Storage Inc. has maintained a steady dividend payout for over two decades, reflecting its commitment to returning value to shareholders. Understanding the history aids in predicting future sustainability and growth.
| Year | Dividend per Share (USD) |
|---|---|
| 2026 | 1.62 |
| 2025 | 6.48 |
| 2024 | 6.48 |
| 2023 | 6.48 |
| 2022 | 6.00 |
📈 Dividend Growth
Recognizing dividend growth rates is essential for forecasting future income potential. EXR has displayed dividend growth, though at a moderate pace over the recent years.
| Time | Growth |
|---|---|
| 3 years | 2.6 % |
| 5 years | 12.5 % |
The average dividend growth is 12.5 % over 5 years. This shows moderate but steady dividend growth.
✅ Payout Ratio
Payout ratios provide insight into the sustainability of a company’s dividend payments in relation to its earnings and cash flow. EXR’s current payout ratios are noteworthy.
| Key figure | Ratio |
|---|---|
| EPS-based | 140.96 % |
| Free cash flow-based | 74.25 % |
The high EPS payout ratio of 140.96 % suggests that the dividend is not fully covered by earnings, posing potential sustainability concerns. However, the FCF-based ratio of 74.25 % indicates more sustainable dividend coverage from cash flows.
⚠️ Cashflow & Capital Efficiency
An understanding of cash flows and capital efficiency is crucial for evaluating the financial health and operational performance of a company.
| Year | 2025 | 2024 | 2023 |
|---|---|---|---|
| Free Cash Flow Yield | 6.63 % | 5.90 % | 5.11 % |
| Earnings Yield | 3.53 % | 2.70 % | 2.96 % |
| CAPEX to Operating Cash Flow | 1.14 % | 1.09 % | 1.14 % |
| Stock-based Compensation to Revenue | 1.05 % | 0.69 % | 1.02 % |
| Free Cash Flow / Operating Cash Flow Ratio | 98.86 % | 98.91 % | 98.86 % |
The free cash flow yields reflect stable cash generation. Stock-based compensation remains low, indicating disciplined capital efficiency.
📉 Balance Sheet & Leverage Analysis
Leverage and liquidity metrics are essential for understanding a company’s financial stability and its ability to meet obligations.
| Year | 2025 | 2024 | 2023 |
|---|---|---|---|
| Debt-to-Equity | 1.11 | 0.93 | 0.78 |
| Debt-to-Assets | 0.51 | 0.45 | 0.41 |
| Debt-to-Capital | 0.53 | 0.48 | 0.44 |
| Net Debt to EBITDA | 6.14 | 5.70 | 6.22 |
| Current Ratio | 1.28 | 0.93 | 0.85 |
| Quick Ratio | 1.28 | 0.93 | 0.85 |
| Financial Leverage | 2.18 | 2.07 | 1.91 |
The leverage ratios present a manageable level of debt compared to equity, providing reasonable financial stability. The liquidity ratios suggest a sufficient ability to meet short-term liabilities.
🔍 Fundamental Strength & Profitability
Understanding profitability and fundamental metrics provides insight into a company’s operational efficiency and overall performance.
| Year | 2025 | 2024 | 2023 |
|---|---|---|---|
| Return on Equity (ROE) | 7.25 % | 6.13 % | 5.58 % |
| Return on Assets (ROA) | 3.33 % | 2.96 % | 2.93 % |
| Net Margin | 28.84 % | 25.61 % | 30.71 % |
| EBIT Margin | 50.31 % | 44.40 % | 49.39 % |
| EBITDA Margin | 71.48 % | 67.70 % | 68.54 % |
| Gross Margin | 28.43 % | 76.31 % | 77.29 % |
| R&D to Revenue | 0 % | 0 % | 0 % |
Profitability remains robust, as reflected in the margins, though reliance on high leverage constrains some of the returns on equity and assets. The absence of R&D expenses highlights a focus on operating efficiencies.
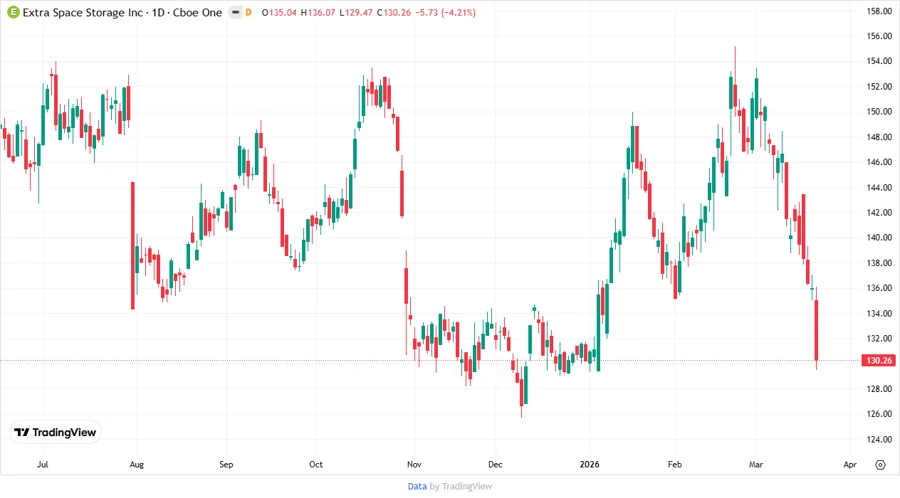
📈 Price Development
🙌 Dividend Scoring System
| Criteria | Score | Visual |
|---|---|---|
| Dividend yield | 4 | |
| Dividend Stability | 5 | |
| Dividend growth | 3 | |
| Payout ratio | 3 | |
| Financial stability | 4 | |
| Dividend continuity | 5 | |
| Cashflow Coverage | 4 | |
| Balance Sheet Quality | 4 |
Total Score: 32/40
🔍 Rating
Overall, Extra Space Storage Inc. is an attractive option for dividend-seeking investors, with a solid track record of payments and a reasonable yield. However, caution should be applied due to its elevated EPS payout ratio, which may challenge the sustainability of its current high dividend levels over the long term. Investors should balance their portfolios considering the trade-offs in growth, stability, and yield offered by EXR.