February 10, 2026 a 12:46 pm

EXR: Dividend Analysis - Extra Space Storage Inc.
Extra Space Storage Inc. ("EXR") exhibits a robust dividend profile with a yield that entices income-focused investors. Despite a high payout ratio, the consistent dividend history underscores a lucrative and steadfast commitment to shareholders. However, potential investors should weigh the sustainability of such payout levels, especially in fluctuating economic conditions.
📊 Overview
Extra Space Storage Inc. is positioned in the REIT sector. The company offers a commendable dividend yield, reflecting solid income opportunities. Its longstanding dividend payment history highlights credibility, yet the prior suspension in 2009 suggests a potential need for caution in economically strained periods.
| Metric | Value |
|---|---|
| Sector | REIT |
| Dividend yield | 4.86 % |
| Current dividend per share | 6.50 USD |
| Dividend history | 22 years |
| Last cut or suspension | 2009 |
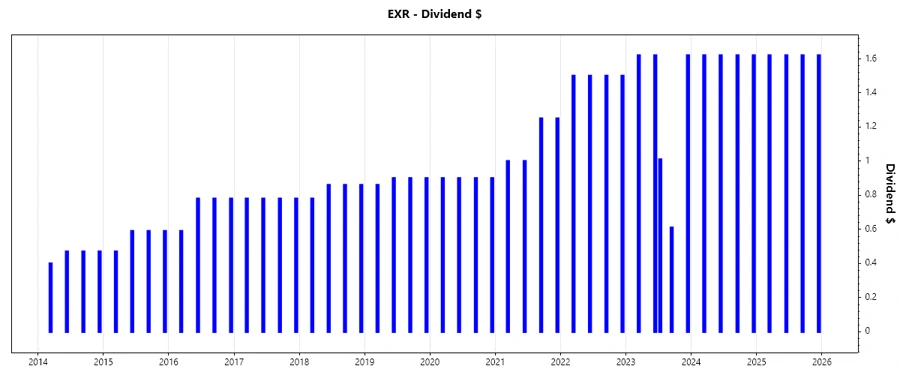
🗣️ Dividend History
Tracking the dividend history of EXR indicates its reliability as a dividend payer. Although the company has demonstrated resilience, its ability to maintain payouts during financial downturns remains crucial for long-term viability.
| Year | Dividend Per Share (USD) |
|---|---|
| 2025 | 6.48 |
| 2024 | 6.48 |
| 2023 | 6.48 |
| 2022 | 6.00 |
| 2021 | 4.50 |
📈 Dividend Growth
The growth trajectory of dividends is a key indicator of a company's financial health and policy priorities. A consistent rise over the past decade suggests potential resilience and profitability in operations.
| Time | Growth |
|---|---|
| 3 years | 2.60 % |
| 5 years | 12.47 % |
The average dividend growth is 12.47% over 5 years. This shows moderate but steady dividend growth.
⚠️ Payout Ratio
The Payout Ratios are high, indicating that the company might be overextended in its dividend commitment relative to earnings and cash flow. This may pose challenges in maintaining dividend levels during downturns.
| Key figure | Ratio |
|---|---|
| EPS-based | 144.51 % |
| Free cash flow-based | 73.14 % |
The high EPS payout ratio of 144.51% is unsustainable long-term, while the FCF payout ratio of 73.14% is more manageable but still on the higher side of caution.
✅ Cashflow & Capital Efficiency
Comprehensive analysis of cash flow and capital efficiency provides insights into EXR's operational proficiency and financial management acumen. High free cash flow yield positions the company favorably for reinvestment and dividend distribution.
| Year | 2024 | 2023 | 2022 |
|---|---|---|---|
| Free Cash Flow Yield | 5.90% | 5.11% | 6.16% |
| Earnings Yield | 2.70% | 2.96% | 4.36% |
| CAPEX to Operating Cash Flow | 1.08% | 1.14% | 1.84% |
| Stock-based Compensation to Revenue | 0.69% | 1.02% | 1.09% |
| Free Cash Flow / Operating Cash Flow Ratio | 98.91% | 98.86% | 98.16% |
The consistent free cash flow yield reflects solid financial management with sufficient room for covering dividend payouts. Capital efficiency measures underscore effective use of invested capital.
Balance Sheet & Leverage Analysis
A robust balance sheet and sound leverage ratios are critical in assessing a company’s ability to withstand financial pressures while still delivering value to shareholders. The ratios provide insight into capital structure and risk management.
| Year | 2024 | 2023 | 2022 |
|---|---|---|---|
| Debt-to-Equity Ratio | 0.93 | 0.78 | 2.32 |
| Debt-to-Assets Ratio | 0.45 | 0.41 | 0.62 |
| Debt-to-Capital Ratio | 0.48 | 0.44 | 0.70 |
| Net Debt to EBITDA | 5.70 | 6.22 | 5.46 |
| Current Ratio | 1.31 | 0.85 | 0.67 |
| Quick Ratio | 0.93 | 0.85 | 0.67 |
With improving debt-to-equity ratios, EXR showcases progression towards a stable capital structure. The financial leverage and quick ratios highlight liquidity management efficiencies amid varying market conditions.
Fundamental Strength & Profitability
Fundamental strength and profitability pivotal in gauging overall operational success and long-term strategic positioning. Measure of return ratios and profitability margins provide a clear depiction of financial robustness.
| Year | 2024 | 2023 | 2022 |
|---|---|---|---|
| Return on Equity (ROE) | 6.13% | 5.58% | 26.40% |
| Return on Assets (ROA) | 2.96% | 2.93% | 7.07% |
| ROIC | 4.49% | 4.22% | 8.61% |
| Net Margin | 25.61% | 30.71% | 43.79% |
| EBIT Margin | 44.40% | 49.39% | 54.90% |
| EBITDA Margin | 67.70% | 68.54% | 69.56% |
Enhanced profitability margins and sustained returns illustrate a competitive edge in generating shareholder value. Continuous operational efficiency drives consistent performance, assuring stable future earnings.
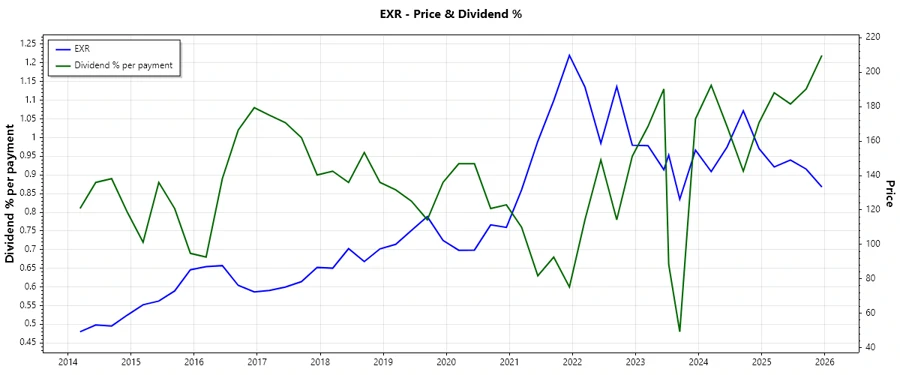
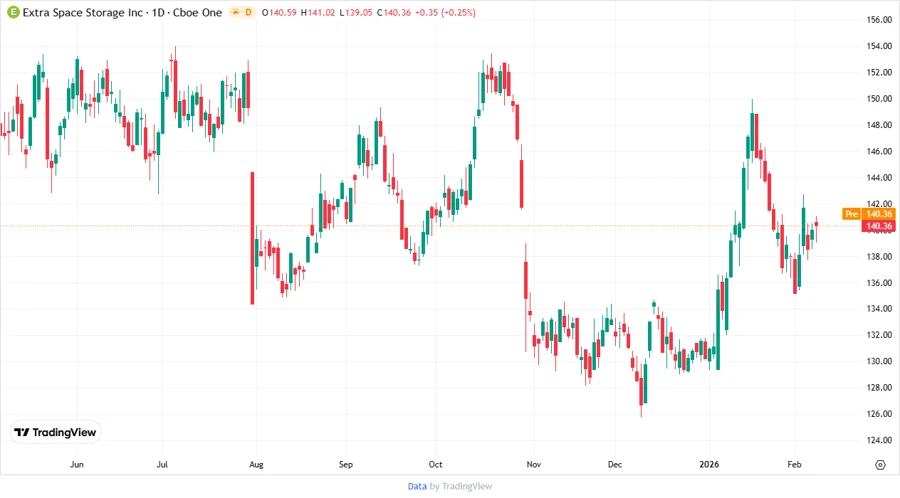
📉 Price Development
🔍 Dividend Scoring System
| Category | Score | |
|---|---|---|
| Dividend yield | 5 | |
| Dividend Stability | 4 | |
| Dividend growth | 3 | |
| Payout ratio | 2 | |
| Financial stability | 3 | |
| Dividend continuity | 4 | |
| Cashflow Coverage | 4 | |
| Balance Sheet Quality | 3 |
Total Score: 28/40
🗳️ Rating
Extra Space Storage Inc. demonstrates strong dividend paying capabilities augmented by respectable financial positions. While high payout ratios spark sustainability concerns, the company maintains favorable cash flow metrics and balance sheet structure. Its dividend yield is particularly attractive for income investors. Caution is advised regarding potential economic pressures, although the company’s operational resilience suggests a promising outlook overall.