December 12, 2025 a 07:46 am
EXR: Dividend Analysis - Extra Space Storage Inc.
Extra Space Storage Inc. shows strong commitment to its shareholders through steadily increasing dividend payouts. Its recent growth and consistent dividend history make it a noteworthy consideration for income-focused investors. However, the firm’s high EPS payout ratio may signal some financial risks, necessitating a closer examination of its financial stability and capital efficiency.
📊 Overview
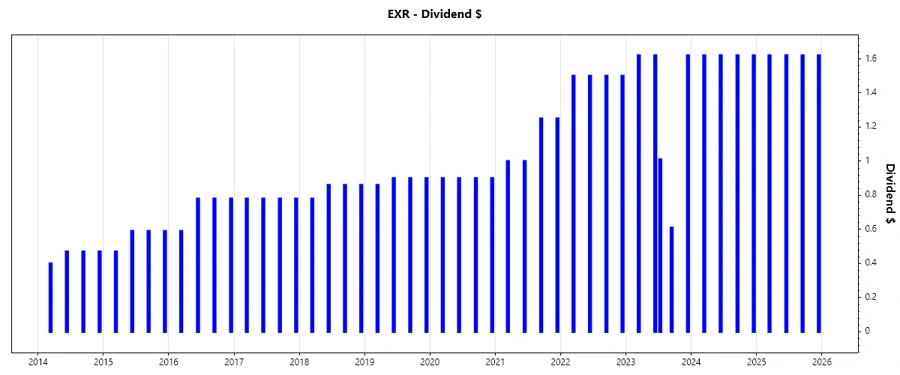
Extra Space Storage operates in the Real Estate sector. The company offers a dividend yield of 4.99%. It has maintained a current dividend per share of 6.50 USD, reflecting a substantial dividend history span of 22 years. The last recorded cut or suspension was in 2009, showcasing remarkable resilience.
| Key Metric | Value |
|---|---|
| Sector | Real Estate |
| Dividend Yield | 4.99% |
| Current Dividend Per Share | 6.50 USD |
| Dividend History | 22 years |
| Last Cut or Suspension | 2009 |
🗣️ Dividend History
Understanding a company's dividend history is crucial for investors seeking consistent and reliable income. Extra Space Storage Inc.'s track record of increasing dividends signifies its robust performance and commitment to shareholder value.
| Year | Dividend per Share (USD) |
|---|---|
| 2025 | 6.48 |
| 2024 | 6.48 |
| 2023 | 6.48 |
| 2022 | 6.00 |
| 2021 | 4.50 |
📈 Dividend Growth
Dividend growth is a key indicator of a company's ability to increase value for its shareholders over time. The growth rates over 3 and 5 years are indicative of Extra Space Storage’s steadfast financial strategy and growth prospects.
| Time | Growth |
|---|---|
| 3 years | 12.92% |
| 5 years | 12.73% |
The average dividend growth is 12.73% over 5 years. This shows moderate but steady dividend growth, which is attractive for long-term income investors.
⚖️ Payout Ratio
Monitoring the payout ratio is vital, as it reveals the proportion of earnings and cash flow used for dividends. High payout ratios might indicate potential issues in maintaining dividend levels.
| Key Figure | Ratio |
|---|---|
| EPS-based | 144.51% |
| Free cash flow-based | 73.14% |
The EPS payout ratio at 144.51% and FCF payout ratio at 73.14% suggest potential strain on sustainability. Typically, such high ratios imply dividends may not be fully sustainable solely from earnings, hinting at reliance on external financing.
💸 Cashflow & Capital Efficiency
The financial health of a company hinges on its cash flow dynamics, showcasing its capability to meet obligations and invest for growth. These metrics provide insight into Extra Space Storage’s efficiency in capital utilization and cash flow stability.
| Year | 2024 | 2023 | 2022 |
|---|---|---|---|
| Free Cash Flow Yield | 5.90% | 5.11% | 6.16% |
| Earnings Yield | 2.70% | 2.96% | 4.36% |
| CAPEX to Operating Cash Flow | 1.09% | 1.14% | 1.84% |
| Stock-based Compensation to Revenue | 0.68% | 1.02% | 1.09% |
| Free Cash Flow / Operating Cash Flow Ratio | 98.91% | 98.86% | 98.16% |
These metrics indicate a solid operational base, with stable cash flow yield and effective capital use. The close alignment of free cash flow with operating cash flow suggests significant stability in cash earnings.
📜 Balance Sheet & Leverage Analysis
A firm's balance sheet positions indicate its financial risk and capacity to withstand economic downturns. Key metrics like debt ratios help evaluate the leverage and liquidity health.
| Year | 2024 | 2023 | 2022 |
|---|---|---|---|
| Debt-to-Equity | 0.93 | 0.78 | 2.32 |
| Debt-to-Assets | 0.45 | 0.41 | 0.62 |
| Debt-to-Capital | 0.48 | 0.44 | 0.70 |
| Net Debt to EBITDA | 5.70 | 6.22 | 5.46 |
| Current Ratio | 0.93 | 0.85 | 0.67 |
| Quick Ratio | 0.93 | 0.85 | 0.67 |
| Financial Leverage | 2.07 | 1.91 | 3.73 |
Extra Space Storage’s leverage ratios indicate moderate debt levels, though its quick ratio warrants caution for liquidity concerns. The balancing of high debt against return prospects remains critical.
💡 Fundamental Strength & Profitability
Metrics such as return on equity and asset margins are vital indicators of profitability and operational efficiency, impacting overall shareholder returns.
| Year | 2024 | 2023 | 2022 |
|---|---|---|---|
| Return on Equity | 6.13% | 5.58% | 26.40% |
| Return on Assets | 2.96% | 2.93% | 7.07% |
| Net Margin | 25.61% | 30.71% | 43.79% |
| EBIT Margin | 44.40% | 49.39% | 54.90% |
| EBITDA Margin | 67.70% | 68.54% | 69.56% |
| Gross Margin | 76.31% | 77.29% | 78.46% |
| Research & Development to Revenue | 0.00% | 0.00% | 0.00% |
The company demonstrates strong operational efficiency, though declining net and EBIT margins imply pressures. It showcases prudent cost management but requires vigilance on profit margins.
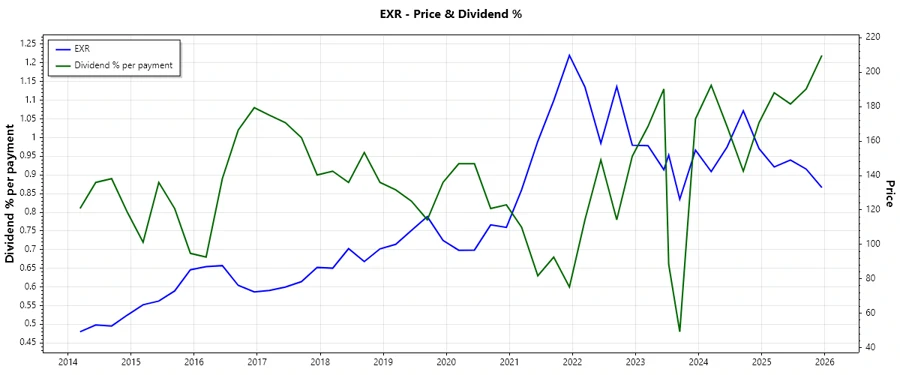
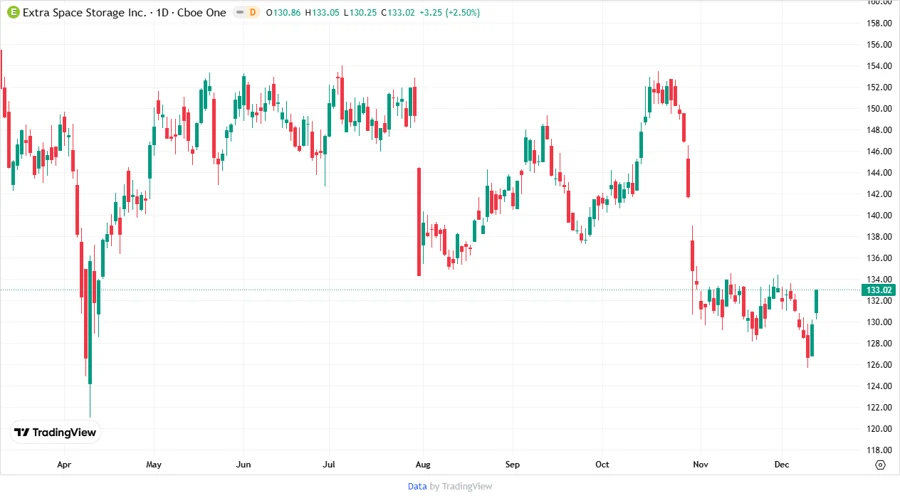
📉 Price Development
✅ Dividend Scoring System
| Category | Score (1-5) | |
|---|---|---|
| Dividend Yield | 4 | |
| Dividend Stability | 5 | |
| Dividend Growth | 3 | |
| Payout Ratio | 2 | |
| Financial Stability | 3 | |
| Dividend Continuity | 4 | |
| Cashflow Coverage | 4 | |
| Balance Sheet Quality | 3 |
Total Score: 28/40
⚠️ Rating
Extra Space Storage Inc. provides a reliable dividend with a strong supporting history. However, investors should be cautious of its high payout ratios, indicating less margin for financial flexibility. Overall, the stock is suitable for investors seeking consistent income, provided they remain aware of the associated financial stability risks.