October 15, 2025 a 07:31 am

EXR: Dividend Analysis - Extra Space Storage Inc.
Extra Space Storage Inc. (EXR) presents a compelling dividend profile with a notable yield of 4.51%. Given its solid 22-year dividend history without recent cuts, EXR demonstrates resilience in maintaining shareholder value. However, investors should be aware of the elevated EPS-based payout ratio, indicating potential constraints on future dividend growth. The continuous increase in dividends reflects the company's commitment to shareholder returns.
📊 Overview
| Metric | Value |
|---|---|
| Sector | Real Estate |
| Dividend yield | 4.51% |
| Current dividend per share | 6.50 USD |
| Dividend history | 22 years |
| Last cut or suspension | None |
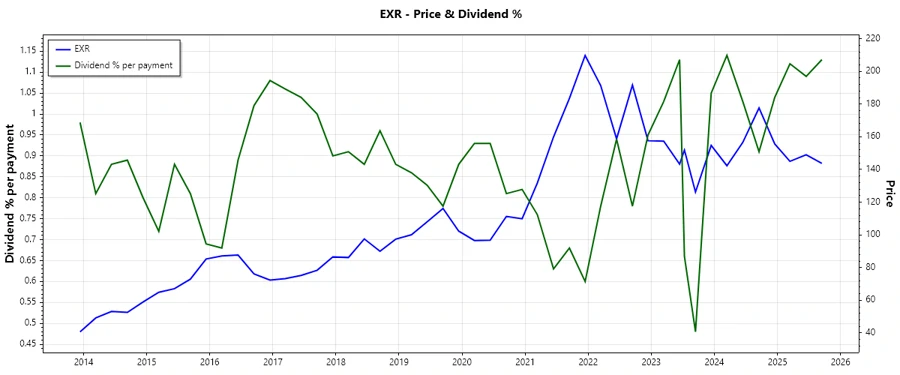
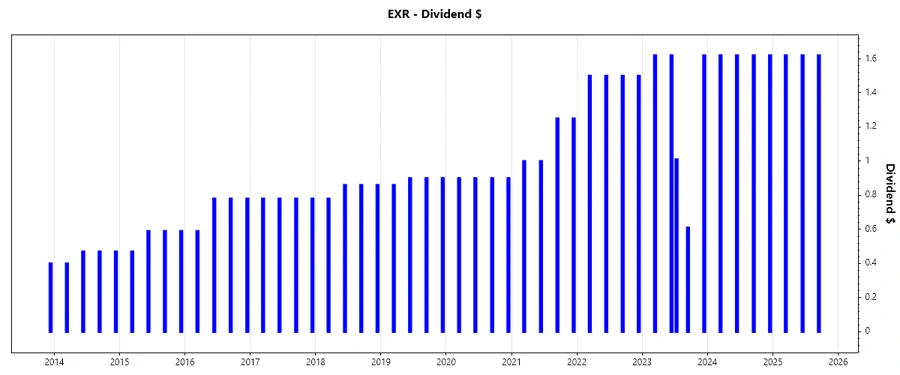
📈 Dividend History
The dividend history of Extra Space Storage Inc. showcases consistent payments, supporting its reputation for reliability. Such historical stability can instill investor confidence and highlights the company's priority on returning cash to shareholders.
| Year | Dividend per Share (USD) |
|---|---|
| 2025 | 4.86 |
| 2024 | 6.48 |
| 2023 | 6.48 |
| 2022 | 6.00 |
| 2021 | 4.50 |
📈 Dividend Growth
The growth in dividends is essential for offsetting inflation and boosting returns. Extra Space Storage has shown consistent growth, indicating strong underlying business performance and management confidence in cash flow.
| Time | Growth |
|---|---|
| 3 years | 12.92% |
| 5 years | 12.73% |
The average dividend growth is 12.73% over 5 years. This shows moderate but steady dividend growth.
🗣️ Payout Ratio
The payout ratio is critical in assessing dividend sustainability. A higher EPS-based payout ratio may suggest potential risks in dividend coverage, whereas the FCF-based ratio is more conservative.
| Key figure | Ratio |
|---|---|
| EPS-based | 141.11% |
| Free cash flow-based | 73.27% |
The EPS-based payout ratio of 141.11% is above the general safe threshold, indicating potential strains on dividend coverage. The FCF-based ratio of 73.27% is within a safer range, suggesting adequate cash flow coverage for dividends.
📊 Cashflow & Capital Efficiency
Analyzing FCF yield and capital efficiency metrics provides insight into the company's financial health and operational robustness. High efficiency indicates potential for sustainable shareholder returns.
| Metric | 2022 | 2023 | 2024 |
|---|---|---|---|
| Free Cash Flow Yield | 6.16% | 5.11% | 5.90% |
| Earnings Yield | 4.36% | 2.96% | 2.70% |
| CAPEX / Operating Cash Flow | 1.84% | 1.14% | 1.09% |
| Stock-based Compensation / Revenue | 1.09% | 1.02% | 0.69% |
| Free Cash Flow / Operating Cash Flow Ratio | 98.16% | 98.86% | 98.91% |
The cash flow metrics depict a strong operational efficiency, with steady free cash flow yield and low CAPEX. This suggests robust cash generation capability, supporting continuous dividends.
🗣️ Balance Sheet & Leverage Analysis
Debt ratios indicate financial leverage and risk, while liquidity ratios assess a company's ability to meet short-term obligations. A strong balance sheet is critical for sustaining dividends.
| Metric | 2022 | 2023 | 2024 |
|---|---|---|---|
| Debt-to-Equity | 2.32 | 0.78 | 0.93 |
| Debt-to-Assets | 62.14% | 40.99% | 45.16% |
| Debt-to-Capital | 69.87% | 43.88% | 48.30% |
| Net Debt to EBITDA | 5.46 | 6.22 | 5.70 |
| Current Ratio | 0.67 | 0.85 | 0.93 |
| Quick Ratio | 0.67 | 0.85 | 0.93 |
| Financial Leverage | 3.73 | 1.91 | 2.07 |
The decrease in debt ratios over time suggests improved financial stability, reducing leverage and enhancing the ability to sustain dividends.
✅ Fundamental Strength & Profitability
Key profitability metrics reveal the company's operational effectiveness and capacity for shareholder returns. Strong profitability supports sustainable dividend payouts and potential growth.
| Metric | 2022 | 2023 | 2024 |
|---|---|---|---|
| Return on Equity | 26.40% | 5.58% | 6.13% |
| Return on Assets | 7.07% | 2.93% | 2.96% |
| Net Margin | 43.79% | 30.71% | 25.61% |
| EBIT Margin | 54.90% | 49.39% | 44.40% |
| EBITDA Margin | 69.56% | 68.54% | 67.70% |
| Gross Margin | 78.46% | 77.29% | 76.31% |
| R&D / Revenue | 0% | 0% | 0% |
Strong return on equity and profit margins indicate effective asset utilization and profitability, underpinning the company's ability to maintain and grow its dividends.
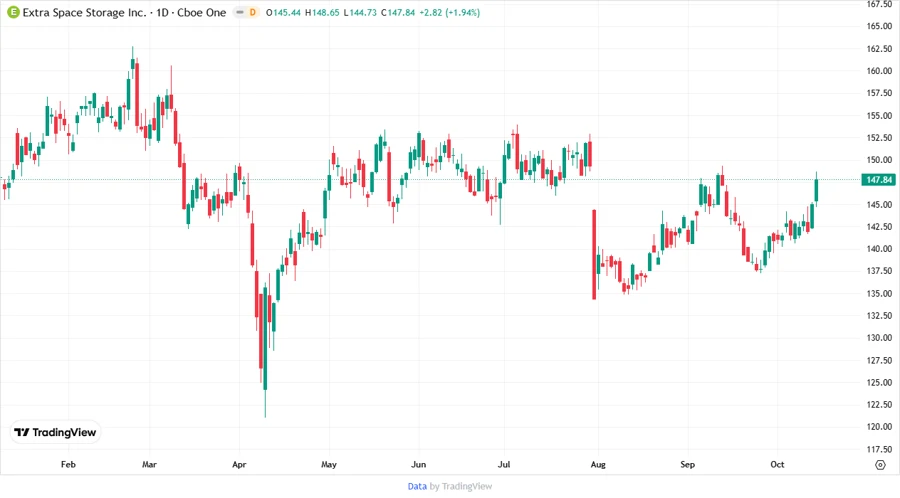
⚠️ Price Development
✅ Dividend Scoring System
| Criteria | Score (out of 5) | Score Bar |
|---|---|---|
| Dividend yield | 4 | |
| Dividend Stability | 5 | |
| Dividend growth | 4 | |
| Payout ratio | 3 | |
| Financial stability | 3 | |
| Dividend continuity | 5 | |
| Cashflow Coverage | 4 | |
| Balance Sheet Quality | 3 |
Total Score: 31/40
🗣️ Rating
Extra Space Storage Inc. is recommended as a stable dividend-paying company suitable for income-focused portfolios. While the high EPS payout ratio advises caution, the company’s solid dividend history and growth indicate a resilient business model.
Smart Data Insight
Master the Perfect Entry & Exit for this Stock
Don't leave your profits to chance. Historically, this stock follows specific seasonal patterns that institutional traders use to maximize returns.
- ✅ Identify the "Golden Buying Window"
- ✅ Avoid high-risk correction cycles
- ✅ Backtested data from the last 20+ years