July 19, 2025 a 03:30 am

EXR: Dividend Analysis - Extra Space Storage Inc.
Extra Space Storage Inc. presents a compelling dividend investment opportunity with a rich history of consistent payouts and moderate growth. The company's notable dividend yield paired with steady growth rates makes it an attractive choice for income-focused investors. However, attention should be paid to the elevated payout ratios which could pose a risk if challenged revenue flows occur.
📊 Overview
Extra Space Storage operates within the Real Estate Investment Trust (REIT) industry. The company's strong historical dividend track record of 22 years signifies its commitment to shareholder returns.
| Aspect | Details |
|---|---|
| Sector | Real Estate |
| Dividend Yield | 4.35% |
| Current Dividend per Share | 6.50 USD |
| Dividend History | 22 years |
| Last Cut or Suspension | None |
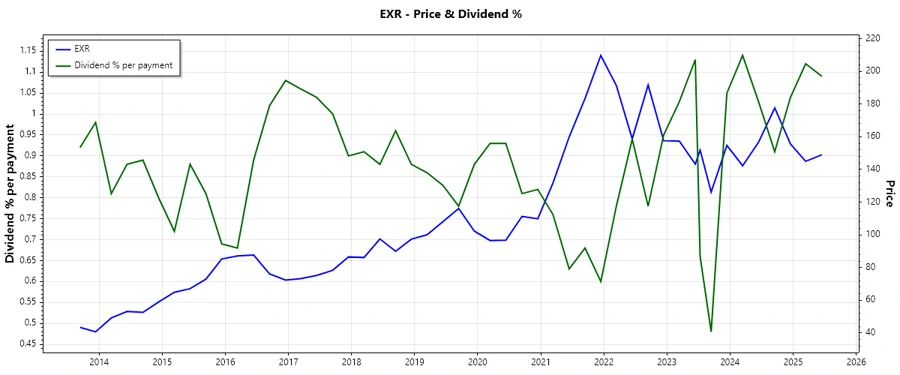
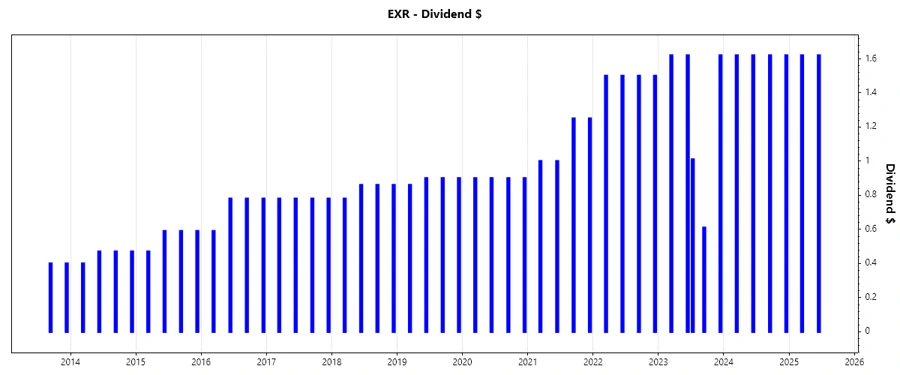
📈 Dividend History
The historical progression of dividends is vital in assessing the company's commitment to maintaining its payout policy even during challenging economic periods. A continuous dividend payment track reflects financial resilience.
| Year | Dividend per Share (USD) |
|---|---|
| 2025 | 3.24 |
| 2024 | 6.48 |
| 2023 | 6.48 |
| 2022 | 6.00 |
| 2021 | 4.50 |
📈 Dividend Growth
Dividend growth rate analysis is crucial as it indicates the company’s ability to increase payouts over time, which can outperform inflation and enhance income.
| Time | Growth |
|---|---|
| 3 years | 12.92% |
| 5 years | 12.73% |
The average dividend growth is 12.73% over 5 years. This shows moderate but steady dividend growth.
🗣️ Payout Ratio
Payout ratios are vital metrics for sustainability. An EPS-based payout ratio of 150.96% could indicate potential risk if profits decrease. Conversely, a lower FCF-based payout ratio at 73.92% suggests healthier scenario in terms of cash flow management.
| Key Figure | Ratio |
|---|---|
| EPS-based | 150.96% |
| Free cash flow-based | 73.92% |
🗣️ Cashflow & Capital Efficiency
Sustainable cash flows and efficient capital deployment are fundamental for maintaining robust dividend policies and reinvesting in business growth. The balance of cash earnings and capital expenditures will support both dividend obligations and strategic initiatives.
| Metric | 2024 | 2023 | 2022 |
|---|---|---|---|
| Free Cash Flow Yield | 5.90% | 5.11% | 6.16% |
| Earnings Yield | 2.70% | 2.96% | 4.36% |
| CAPEX to Operating Cash Flow | - | 1.14% | 1.84% |
| Stock-based Compensation to Revenue | 0.70% | 1.04% | 1.11% |
| Free Cash Flow / Operating Cash Flow Ratio | 98.91% | 98.86% | 98.16% |
The metrics indicate a stable cash flow position and prudent capital management, which are essential for sustained dividend payments and investment in new opportunities.
⚠️ Balance Sheet & Leverage Analysis
Balance sheet strength and leverage levels are crucial for determining a company’s financial health and its ability to withstand industry and economic volatilities, impacting the safety of dividends.
| Metric | 2024 | 2023 | 2022 |
|---|---|---|---|
| Debt-to-Equity | 0.93 | 0.78 | 2.32 |
| Debt-to-Assets | 0.45 | 0.41 | 0.62 |
| Debt-to-Capital | 0.48 | 0.44 | 0.70 |
| Net Debt to EBITDA | 5.52 | 6.22 | 5.63 |
| Current Ratio | 1.23 | 0.85 | 0.08 |
| Quick Ratio | 0.93 | 0.85 | 0.67 |
| Financial Leverage | 2.07 | 1.91 | 3.73 |
The leverage ratios indicate a balanced capital structure with an emphasis on financial stability, necessary for consistent dividend disbursement.
📊 Fundamental Strength & Profitability
Profitability and fundamental strength form the foundation of sustainable dividend policies, highlighting the company's efficiency in generating earnings from its resources.
| Metric | 2024 | 2023 | 2022 |
|---|---|---|---|
| Return on Equity | 6.13% | 5.58% | 26.40% |
| Return on Assets | 2.96% | 2.93% | 7.07% |
| Margins: Net | 26.24% | 31.37% | 44.73% |
| Margins: EBIT | 46.94% | 51.16% | 60.35% |
| Margins: EBITDA | 66.26% | 70.01% | 68.91% |
| Margins: Gross | 72.20% | 73.80% | 75.63% |
| Research & Development to Revenue | 0.00% | 0.00% | 0.00% |
The returns and margins consistently reinforce the company’s ability to generate and sustain high profitability levels, imperative for long-term dividends.
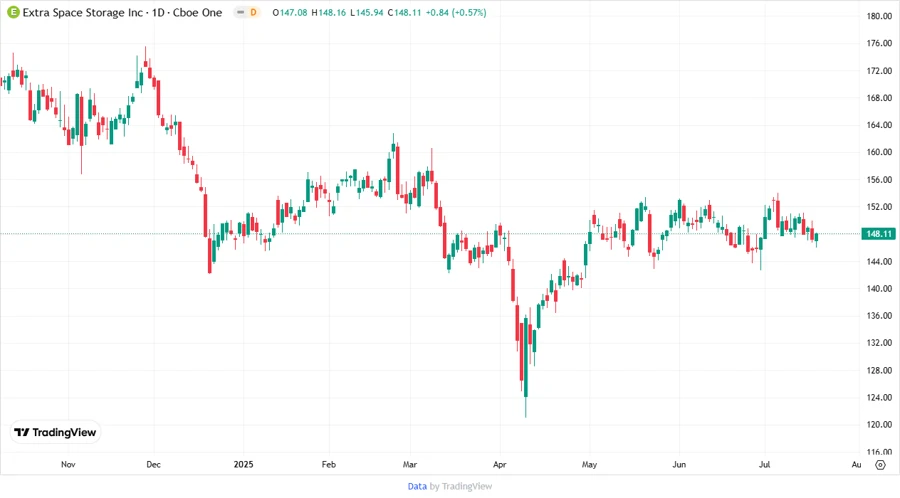
📉 Price Development
✅ Dividend Scoring System
| Criterion | Score | Bar |
|---|---|---|
| Dividend Yield | 4 | |
| Dividend Stability | 5 | |
| Dividend Growth | 3 | |
| Payout Ratio | 2 | |
| Financial Stability | 3 | |
| Dividend Continuity | 4 | |
| Cashflow Coverage | 4 | |
| Balance Sheet Quality | 3 |
Total Score: 28/40
⭐ Rating
Extra Space Storage Inc. demonstrates strong dividend sustainability with its robust history, underpinned by solid profitability metrics. Its moderate growth and consistent financial policies support a favorable outlook, albeit with caution advised due to high payout ratios.
Smart Data Insight
Master the Perfect Entry & Exit for this Stock
Don't leave your profits to chance. Historically, this stock follows specific seasonal patterns that institutional traders use to maximize returns.
- ✅ Identify the "Golden Buying Window"
- ✅ Avoid high-risk correction cycles
- ✅ Backtested data from the last 20+ years