May 16, 2026 a 08:00 am
EXPE: Fundamental Ratio Analysis - Expedia Group, Inc.
Expedia Group operates as a leading online travel company, navigating a competitive market with a diverse brand portfolio. While the stock shows promise with robust ROE and ROA figures, its high debt-to-equity ratio remains a concern. Investors should consider these factors alongside market conditions when evaluating EXPE.
Fundamental Rating
Expedia Group demonstrates solid fundamentals, highlighted by a commendable return on equity and assets but offset by a lower debt-to-equity score.
| Category | Score | Visual |
|---|---|---|
| Discounted Cash Flow | 4 | |
| Return on Equity | 5 | |
| Return on Assets | 5 | |
| Debt to Equity | 1 | |
| Price to Earnings | 3 | |
| Price to Book | 1 |
Historical Rating
A comparative analysis of the past and present scores shows a stable outlook, with consistency in its overall score and individual metrics.
| Date | Overall | DCF | ROE | ROA | D/E | P/E | P/B |
|---|---|---|---|---|---|---|---|
| 2026-05-15 | 3 | 4 | 5 | 5 | 1 | 3 | 1 |
| Prior Period | 0 | 4 | 5 | 5 | 1 | 3 | 1 |
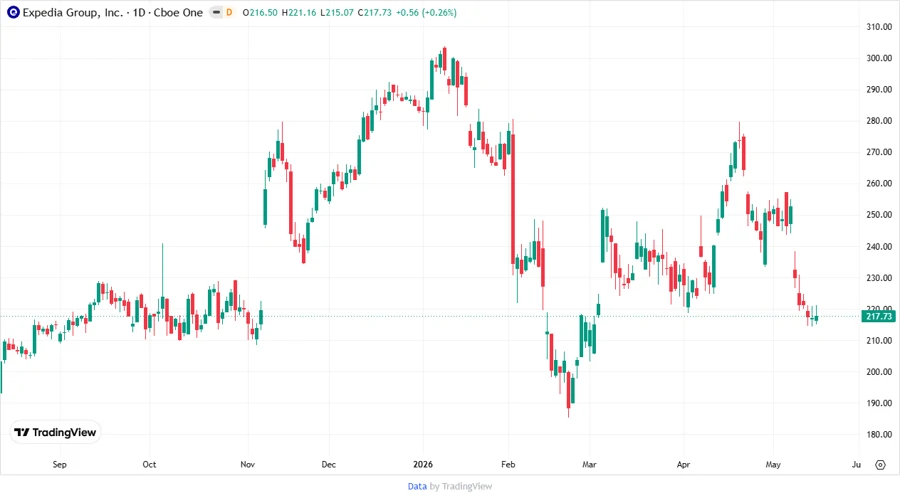
Analyst Price Targets
Analyst projections stay within a broad range, reflecting varied market sentiments with a median price target below consensus estimates.
| High | Low | Median | Consensus |
|---|---|---|---|
| $330 | $240 | $260 | $271.47 |
Analyst Sentiment
The consensus suggests a 'Hold', evenly split between buy and hold recommendations with minimal sell advice.
| Recommendation | Count | Distribution |
|---|---|---|
| Strong Buy | 0 | |
| Buy | 34 | |
| Hold | 39 | |
| Sell | 2 | |
| Strong Sell | 0 |
Conclusion
While Expedia Group exhibits strong operational metrics, its balance sheet's leverage is a point of caution for investors. The company's growth potential is supported by a strong brand portfolio and diverse global presence, yet market uncertainties and competition in the online travel sector present significant risks. Investors should weigh the stable analyst consensus and historical ratings with their risk tolerance. The potential for future growth, alongside stable earnings performance, can appeal to balanced investors.
Smart Data Insight
Master the Perfect Entry & Exit for this Stock
Don't leave your profits to chance. Historically, this stock follows specific seasonal patterns that institutional traders use to maximize returns.
- ✅ Identify the "Golden Buying Window"
- ✅ Avoid high-risk correction cycles
- ✅ Backtested data from the last 20+ years