May 11, 2026 a 04:45 pm
EXPE: Fibonacci Analysis - Expedia Group, Inc.
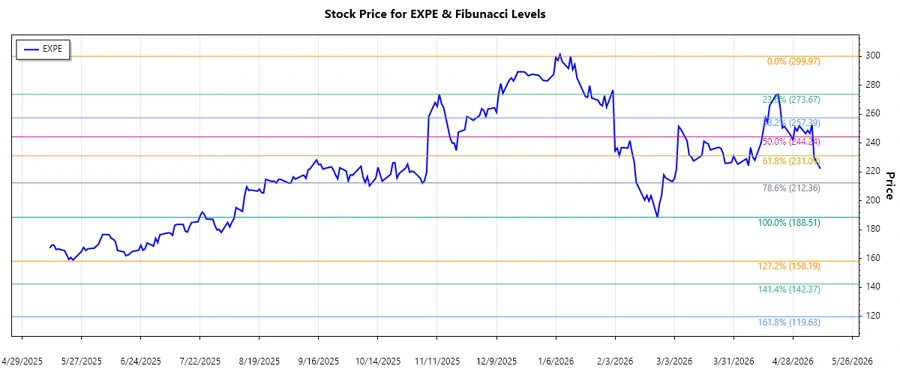
Expedia Group, Inc. has shown significant activity in the online travel sector, catering to both leisure and corporate travelers. In recent months, the stock exhibited strong volatility, reflecting the company's dynamic business segments. The latest trend analysis indicates an important movement in the stock price, which could signal future opportunities or risks for potential investors.
Fibonacci Analysis
| Trend Analysis | Details | ||||||||||||
|---|---|---|---|---|---|---|---|---|---|---|---|---|---|
| Start Date | 2025-11-11 | ||||||||||||
| End Date | 2026-05-07 | ||||||||||||
| High Price (Date) | $299.97 (2026-01-13) | ||||||||||||
| Low Price (Date) | $188.51 (2026-02-23) | ||||||||||||
| Fibonacci Levels |
|
||||||||||||
| Current Price Zone | The current price is in the 0.236 retracement zone. | ||||||||||||
| Interpretation | This suggests potential support at the 0.236 level; however, a breach could indicate further downside risks. |
Conclusion
The Expedia Group's stock has demonstrated considerable volatility, which is both an opportunity for traders and a risk for conservative investors. The identified retracement levels serve as key indicators of potential support and resistance, informing entry and exit strategies. Given the current price position within the 0.236 Fibonacci level, investors should be cautious and watch for any break below this level, which would suggest increased bearish momentum. On the upside, a recovery past the higher retracement levels could reinstate bullish confidence. Ultimately, the ongoing examination of market conditions and careful monitoring of these technical indicators will be crucial for informed trading decisions.
Smart Data Insight
Master the Perfect Entry & Exit for this Stock
Don't leave your profits to chance. Historically, this stock follows specific seasonal patterns that institutional traders use to maximize returns.
- ✅ Identify the "Golden Buying Window"
- ✅ Avoid high-risk correction cycles
- ✅ Backtested data from the last 20+ years