March 11, 2026 a 10:16 am
EXPE: Fibonacci Analysis - Expedia Group, Inc.
Expedia Group, Inc. shows a strong dominance in the online travel industry with an extensive portfolio offering diverse travel services. The company's recent stock performance indicates volatility, reflecting broader market trends. A detailed Fibonacci analysis provides insights into potential support and resistance levels based on historical price action.
Fibonacci Analysis
| Parameter | Value |
|---|---|
| Start Date | 2026-01-08 |
| End Date | 2026-03-10 |
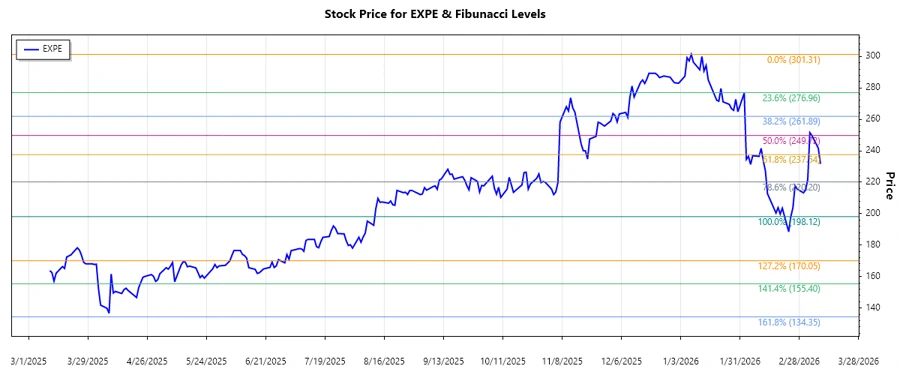
| High Point (Price & Date) | $301.31 on 2026-01-08 |
| Low Point (Price & Date) | $198.12 on 2026-02-24 |
| Fibonacci Level | Price Level |
|---|---|
| 0.236 | $231.89 |
| 0.382 | $246.97 |
| 0.5 | $259.72 |
| 0.618 | $272.47 |
| 0.786 | $290.19 |
The current price sits just below the 0.236 retracement level, indicating potential support at this level. A breach here may signal a continuation of the downward trend.
Conclusion
Expedia Group, Inc. is positioned at a critical juncture, with Fibonacci analysis spotlighting potential support near the 0.236 level. This provides technical traders an opportunity to assess entry or exit points contingent on price action. While the macroeconomic environment suggests caution, Expedia's diversified portfolio could buffer adverse impacts. Monitoring industry trends and broader market conditions remains essential for future decision-making.