July 12, 2025 a 11:44 am
EXPE: Fibonacci Analysis - Expedia Group, Inc.
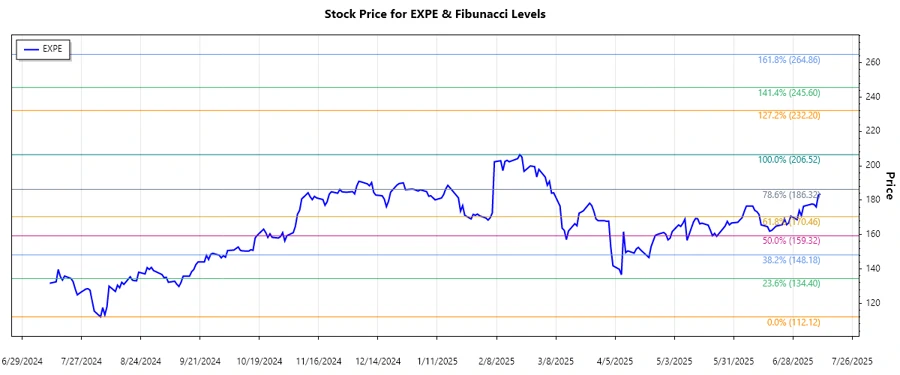
Expedia Group, Inc. has shown resilience in its stock performance with recent movements indicating a significant trend. Through a comprehensive analysis of the stock data, there appears to be a dominant upward trend over the past few months. Investors should consider the calculated support and resistance levels obtained through the Fibonacci retracement to optimize entry and exit points. The company's diverse portfolio continues to buoy its market position strongly.
Fibonacci Analysis
| Details | Information |
|---|---|
| Trend Duration | From 2024-08-06 to 2025-07-11 |
| High Point | 206.52 on 2025-02-19 |
| Low Point | 112.12 on 2024-08-05 |
| Fibonacci Level | Price Level |
|---|---|
| 0.236 | 145.60 |
| 0.382 | 157.87 |
| 0.5 | 168.32 |
| 0.618 | 178.77 |
| 0.786 | 192.15 |
As of the latest data, the current price is hovering around the 0.618 Fibonacci retracement level. This suggests a potential support level, indicating that the upward trend may sustain if there is enough buying pressure.
Technically, the proximity of the current price to the 0.618 level often signifies a pivotal point which could translate into either a rally or a breakdown, making it a critical level for traders.
Conclusion
The Expedia Group, Inc. stock has shown strong upward momentum, reflecting positively on its recent market activities. The stock's proximity to the 0.618 Fibonacci retracement level suggests a likely level of support, which might encourage bullish strategies from investors. However, investors should also be cautious of potential resistance as prices approach higher Fibonacci levels, indicating overbought conditions that could precipitate a reversal. Overall, the stock remains an attractive proposition for growth-oriented investors while offering multiple resistance and support cues for technical traders.
Smart Data Insight
Master the Perfect Entry & Exit for this Stock
Don't leave your profits to chance. Historically, this stock follows specific seasonal patterns that institutional traders use to maximize returns.
- ✅ Identify the "Golden Buying Window"
- ✅ Avoid high-risk correction cycles
- ✅ Backtested data from the last 20+ years