
June 30, 2026 a 03:30 pm
EXPE: Dividend Analysis - Expedia Group, Inc.
Expedia Group, Inc. presents a captivating dividend profile with a moderate yield juxtaposed with a sturdy payout ratio. Its consistent dividend history over 13 years demonstrates a commitment to returning value to its shareholders. Despite the relatively low yield, the stability and potential for growth make it a notable consideration for income-focused portfolios. However, the low dividend growth over the past few years suggests an area for improvement for the company to enhance its attractiveness to dividend growth investors.
📊 Overview
Expedia operates within the volatile but potentially lucrative sector of online travel services. The company's current dividend yield stands at 0.77%, with a dividend per share of approximately $1.60. Over the last 13 years, the firm has maintained a commendable track record of paying dividends, with no recent cuts or suspensions apparent.
| Metric | Details |
|---|---|
| Sector | Online Travel Services |
| Dividend yield | 0.77% |
| Current dividend per share | $1.60 USD |
| Dividend history | 13 years |
| Last cut or suspension | None |
💰 Dividend History
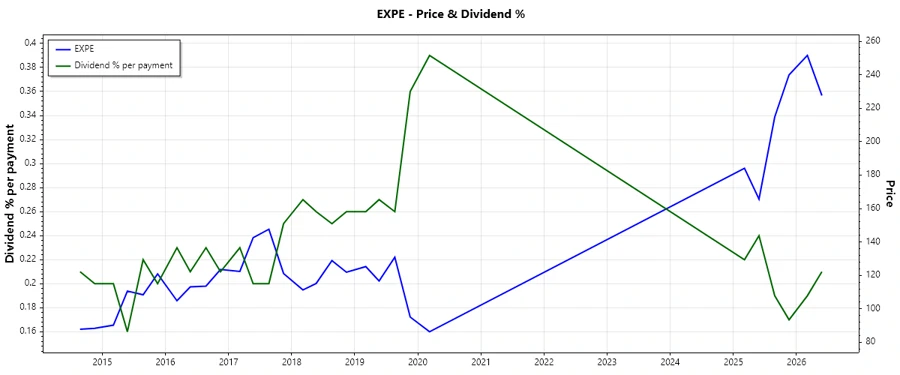
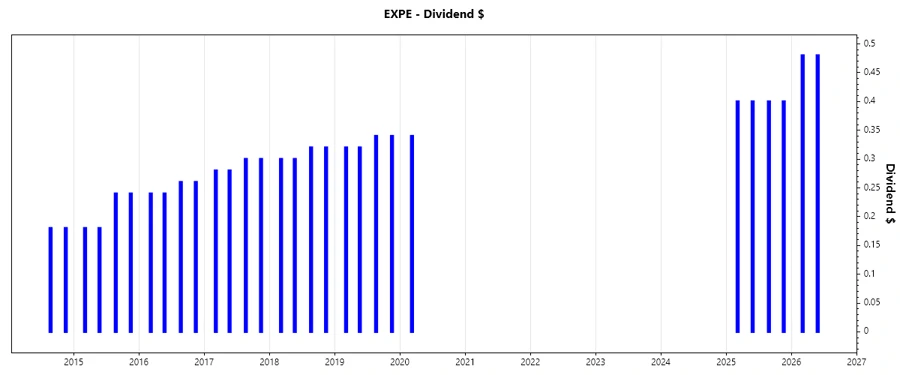
The dividend history showcases Expedia's effort to consistently provide shareholder value through quarterly payouts. This reliability can be a cornerstone for investors valuing predictable income over volatile stock price movements. The history underscores not only consistent dividends but also demonstrates resilience during financial downturns.
| Year | Dividend Per Share (USD) |
|---|---|
| 2026 | 0.96 |
| 2025 | 1.60 |
| 2020 | 0.34 |
| 2019 | 1.32 |
| 2018 | 1.24 |
📈 Dividend Growth
Dividend growth is a vital indicator for ensuring future income streams keep pace with inflation. The modest growth over the last 3 and 5 years reflects a cautious but positive trajectory. Investors should weigh this against other income-generating options.
| Time | Growth |
|---|---|
| 3 years | 0.68% |
| 5 years | 0.36% |
The average dividend growth is 0.36% over 5 years. This shows moderate but steady dividend growth.
🧾 Payout Ratio
The payout ratio signifies how sustainable a company's dividend payments are in relation to its earnings and free cash flow. Expedia's EPS-based payout ratio is 13.06%, while the FCF-based payout ratio is 3.90%, indicating dividends are well-covered by earnings and cash flow.
| Key figure | Ratio |
|---|---|
| EPS-based | 13.06% |
| Free cash flow-based | 3.90% |
Such conservative payout ratios suggest ample room for potential dividend increases or unexpected downturns.
💼 Cashflow & Capital Efficiency
Cash flow analysis is essential for understanding the operational health and capital utilization of a firm. Expedia's financials reveal a favorable free cash flow yield of 15.75% and an earnings yield of 4.70%, indicating solid cash generation capabilities relative to market expectations.
| Metric | 2023 | 2024 | 2025 |
|---|---|---|---|
| Free Cash Flow Yield | 8.38% | 9.51% | 8.76% |
| Earnings Yield | 3.62% | 5.04% | 3.64% |
| CAPEX to Operating Cash Flow | 31.45% | 24.51% | 19.84% |
| Stock-based Compensation to Revenue | 3.22% | 3.35% | 2.70% |
| Free Cash Flow / Operating Cash Flow Ratio | 68.55% | 75.49% | 80.15% |
Expedia's cash flow metrics point to robust operational efficiency and prudent capital allocation strategies.
📐 Balance Sheet & Leverage Analysis
A strong balance sheet reinforces a firm's ability to service debt and pursue growth opportunities. Expedia exhibits a debt-to-equity ratio of 5.19 and a net debt to EBITDA of -1.00, suggesting financial leverage is managed within acceptable parameters.
| Metric | 2023 | 2024 | 2025 |
|---|---|---|---|
| Debt-to-Equity | 4.28 | 4.19 | 5.19 |
| Debt-to-Assets | 30.34% | 29.17% | 27.27% |
| Debt-to-Capital | 81.06% | 80.75% | 83.86% |
| Net Debt to EBITDA | 1.13 | 0.89 | -0.11 |
| Current Ratio | 0.78 | 0.72 | 0.73 |
| Quick Ratio | 0.78 | 0.72 | 0.73 |
| Financial Leverage | 14.11 | 14.38 | 19.04 |
Expedia's leverage metrics highlight its ability to manage debt effectively while maintaining operational liquidity.
🌟 Fundamental Strength & Profitability
Assessing profitability ratios sheds light on the efficiency of resource usage relative to revenue generation. Expedia's return on equity of 1.48% in 2023, alongside a net profit margin of 8.78%, reflect solid profitability.
| Metric | 2023 | 2024 | 2025 |
|---|---|---|---|
| Return on Equity | 1.48% | 0.79% | 1.01% |
| Return on Assets | 3.68% | 3.21% | 5.29% |
| Margins: Net | 6.21% | 9.01% | 8.78% |
| EBIT | 9.84% | 13.06% | 12.83% |
| EBITDA | 16.12% | 19.18% | 18.85% |
| Gross | 87.75% | 89.46% | 90.11% |
| Research & Development to Revenue | 10.58% | 9.60% | 8.67% |
These metrics confirm a stable profitability trajectory, underscoring strength in core operations and cost containment strategies.
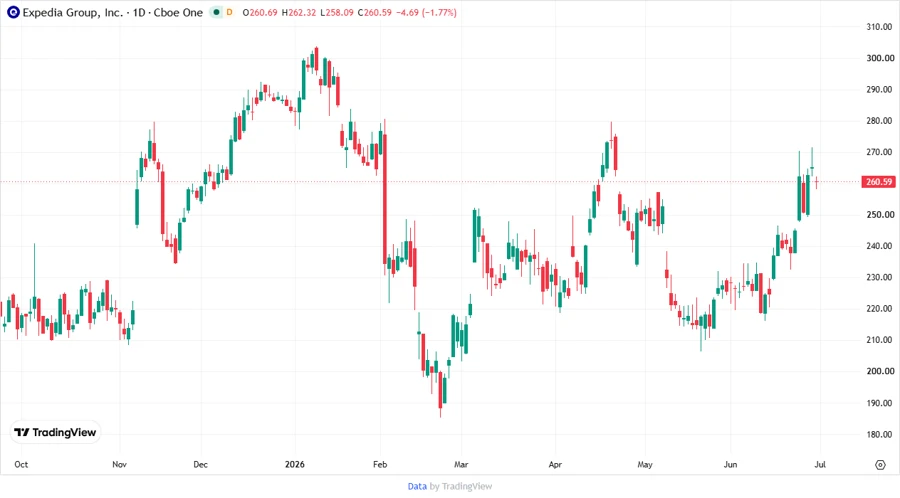
📉 Price Development
🔍 Dividend Scoring System
| Category | Score | Score Indicator |
|---|---|---|
| Dividend yield | 2 | |
| Dividend Stability | 4 | |
| Dividend growth | 1 | |
| Payout ratio | 4 | |
| Financial stability | 3 | |
| Dividend continuity | 5 | |
| Cashflow Coverage | 4 | |
| Balance Sheet Quality | 4 |
Total Score: 27/40
✅ Rating
Expedia Group, Inc. earns a respectable position in the realm of dividend-paying stocks. While its yield may not be its defining feature, the strong stability and coverage of its dividends are noteworthy. With prudent financial management and a forward-looking growth strategy, Expedia holds promise for investors seeking a balance of income and capital appreciation potential. It rates as a moderate 'Buy' for those prioritizing dividend continuity and operational resilience.
Smart Data Insight
Master the Perfect Entry & Exit for this Stock
Don't leave your profits to chance. Historically, this stock follows specific seasonal patterns that institutional traders use to maximize returns.
- ✅ Identify the "Golden Buying Window"
- ✅ Avoid high-risk correction cycles
- ✅ Backtested data from the last 20+ years