March 11, 2026 a 12:46 pm

EXPE: Dividend Analysis - Expedia Group, Inc.
Expedia Group, Inc. represents a noteworthy investment opportunity due to its unique market position and attractive dividend attributes. While it offers a relatively modest dividend yield, the historical consistency of distributions coupled with moderate growth stands out positively. However, investors should be cautious of any potential headwinds that might impact future payouts.
Overview 📊
Analyzing the company reveals a significant track record in maintaining a consistent dividend policy, alongside metrics demonstrating a sustainable financial backbone.
| Metric | Value |
|---|---|
| Sector | Consumer Cyclical |
| Dividend yield | 0.67% |
| Current dividend per share | 1.60 USD |
| Dividend history | 13 years |
| Last cut or suspension | None |
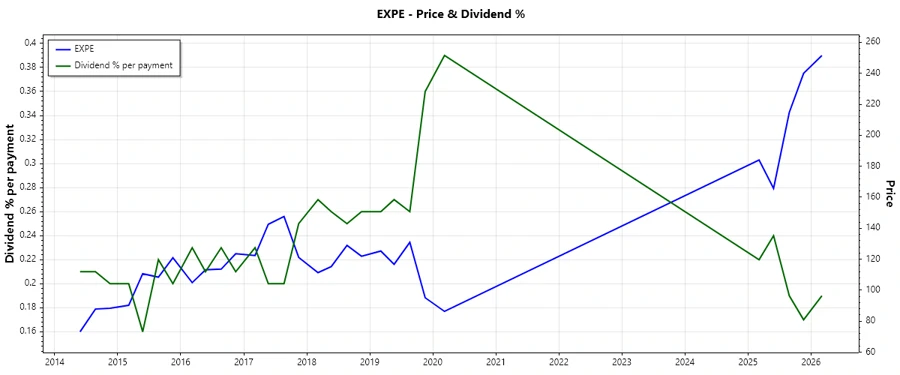
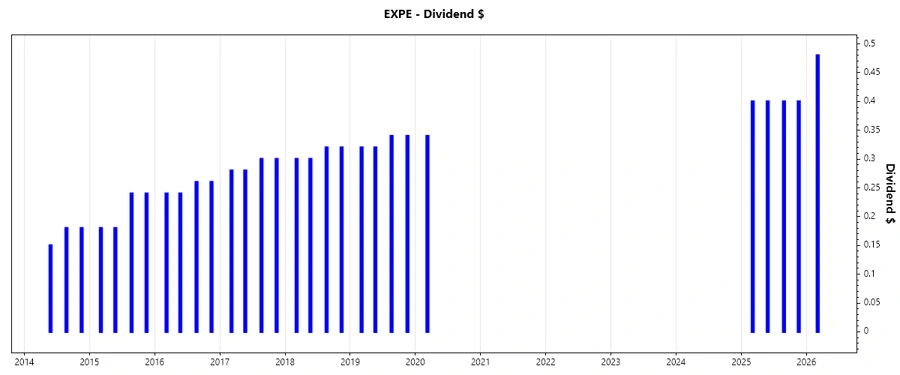
Dividend History 🗣️
Expedia Group’s dedication to sustaining its dividends is notable with a history of over a decade. This consistency is crucial for long-term investors seeking reliable income streams.
| Year | Dividend per Share (USD) |
|---|---|
| 2026 | 0.48 |
| 2025 | 1.60 |
| 2020 | 0.34 |
| 2019 | 1.32 |
| 2018 | 1.24 |
Dividend Growth 📈
Despite a modest overall dividend yield, Expedia shows a pattern of moderate growth over recent years. This consistent increment enhances the company’s appeal to growth-oriented dividend investors.
| Time | Growth |
|---|---|
| 3 years | 0.68% |
| 5 years | 0.36% |
The average dividend growth is 0.36% over 5 years. This shows moderate but steady dividend growth.
Payout Ratio 📉
Payout ratios are a strong indicator of the company's ability to sustain its dividend payments, with EPS-based at 15.13% and FCF-based at 5.05%, suggesting ample room for maintaining dividends.
| Key figure | Ratio |
|---|---|
| EPS-based | 15.13% |
| Free cash flow-based | 5.05% |
These low payout ratios highlight a strong potential for continued dividend payments, building confidence in the company's financial strategies.
Cashflow & Capital Efficiency ✅
Expedia's cashflow and capital efficiency metrics present a robust picture of its financial health, critical for ensuring ongoing investor returns and enabling growth investments.
| Metric | 2025 | 2024 | 2023 |
|---|---|---|---|
| Free Cash Flow Yield | 8.76% | 9.51% | 8.38% |
| Earnings Yield | 3.64% | 5.04% | 3.62% |
| CAPEX to Operating Cash Flow | 19.85% | 24.51% | 31.45% |
| Stock-based Compensation to Revenue | 2.70% | 3.35% | 3.22% |
| Free Cash Flow / Operating Cash Flow Ratio | 80.15% | 75.49% | 68.55% |
These measures are key indicators of the company's ability to generate steady cash flow, manage costs, and invest in future growth—favorable traits for sustaining its dividend payouts.
Balance Sheet & Leverage Analysis ⚠️
Understanding leverage and balance sheet metrics informs on potential risk exposure. Expedia's high financial leverage ratio indicates a high use of debt in its capital structure.
| Metric | 2025 | 2024 | 2023 |
|---|---|---|---|
| Debt-to-Equity | 5.19 | 4.19 | 4.28 |
| Debt-to-Assets | 27.27% | 29.17% | 30.34% |
| Debt-to-Capital | 83.86% | 80.75% | 81.06% |
| Net Debt to EBITDA | -0.11 | 0.89 | 1.13 |
| Current Ratio | 0.73 | 0.72 | 0.78 |
| Quick Ratio | 0.73 | 0.72 | 0.78 |
| Financial Leverage | 19.04 | 14.38 | 14.11 |
While the high leverage may present risks, the company's decent current and quick ratios suggest adequate capacity to meet short-term obligations.
Fundamental Strength & Profitability 📈
The company's profitability measures highlight steady operational performance along with focused expenses management through R&D reinvestments.
| Metric | 2025 | 2024 | 2023 |
|---|---|---|---|
| Return on Equity | 100.78% | 79.25% | 51.96% |
| Return on Assets | 5.29% | 5.51% | 3.68% |
| Margins: Net | 8.78% | 9.01% | 6.21% |
| Margins: EBIT | 13.43% | 13.06% | 9.84% |
| Margins: EBITDA | 19.45% | 19.18% | 16.12% |
| Margins: Gross | 84.10% | 89.46% | 87.75% |
| Research & Development to Revenue | 8.67% | 9.60% | 10.58% |
Such profitability metrics underpin strong operational prowess. Expedia’s margins indicate effective cost structure, fostering overall profitability.
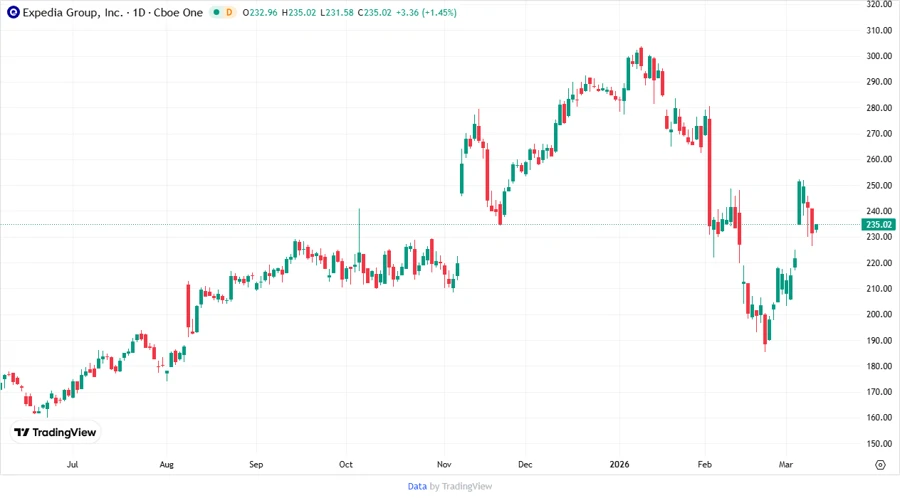
Price Development 📈
Dividend Scoring System 🏆
| Category | Score | Score Bar |
|---|---|---|
| Dividend yield | 2 | |
| Dividend Stability | 4 | |
| Dividend growth | 3 | |
| Payout ratio | 5 | |
| Financial stability | 3 | |
| Dividend continuity | 5 | |
| Cashflow Coverage | 4 | |
| Balance Sheet Quality | 3 |
Total Score: 29 / 40
Rating 🏅
Overall, Expedia Group, Inc. presents as a moderately appealing dividend stock. While the dividend yield is relatively low, the company shows commendable efforts in maintaining stability and growth. The financial underpinnings support dividend sustainability, although high leverage warrants attention. Investors may find both income and growth potential, supplemented by adequate risk management.
Smart Data Insight
Master the Perfect Entry & Exit for this Stock
Don't leave your profits to chance. Historically, this stock follows specific seasonal patterns that institutional traders use to maximize returns.
- ✅ Identify the "Golden Buying Window"
- ✅ Avoid high-risk correction cycles
- ✅ Backtested data from the last 20+ years