February 15, 2026 a 03:30 am

EXPE: Dividend Analysis - Expedia Group, Inc.
Expedia Group, Inc. presents a relatively low dividend yield, which might not attract income-focused investors. However, the company has a solid history of dividend payments, and with a moderate dividend growth rate over the past five years, it continues to demonstrate commitment to returning value to shareholders. The payout ratios indicate a conservative approach, which could signify potential for future dividend increases.
📊 Overview
Expedia operates in the Consumer Services sector, providing global travel services. The company's current dividend yield stands at 0.79%, with a dividend payout of 1.60 USD per share. It has a 13-year continuous dividend history, demonstrating reliability. The absence of recent dividend cuts or suspensions is a positive sign, indicating stable financial health.
| Sector | Dividend Yield (%) | Current Dividend Per Share (USD) | Dividend History (years) | Last Cut or Suspension |
|---|---|---|---|---|
| Consumer Services | 0.79 | 1.60 | 13 | None |
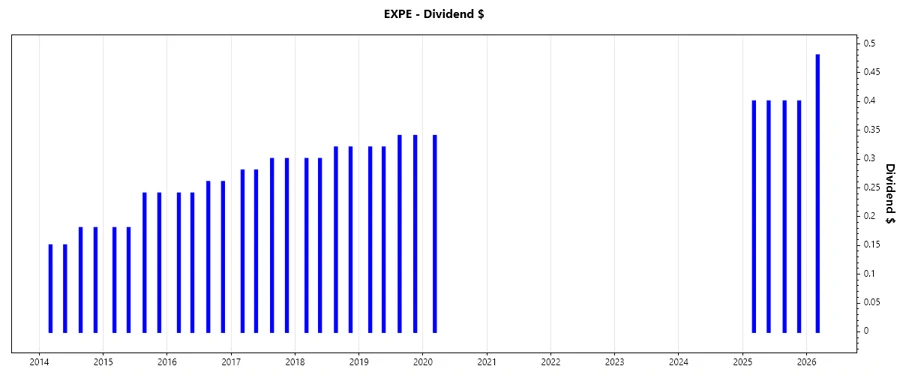
🗣️ Dividend History
Reviewing dividend history is crucial for understanding long-term commitment to dividends. It illustrates the company's ability to maintain or grow its payouts over time, which is a factor of financial health.
| Year | Dividend Per Share (USD) |
|---|---|
| 2026 | 0.48 |
| 2025 | 1.60 |
| 2020 | 0.34 |
| 2019 | 1.32 |
| 2018 | 1.24 |
📈 Dividend Growth
Dividend growth trends are vital for assessing potential future income streams. Consistent growth can be a strong indicator of financial stability and management's confidence.
| Time | Growth (%) |
|---|---|
| 3 years | 0.68 |
| 5 years | 0.36 |
The average dividend growth is 0.36% over 5 years. This shows moderate but steady dividend growth.
⚠️ Payout Ratio
Payout ratios help assess whether a company can sustain its dividend payments. Lower ratios suggest greater flexibility in maintaining or raising dividends.
| Key Figure | Ratio (%) |
|---|---|
| EPS-based | 15.13 |
| Free cash flow-based | 5.05 |
The EPS payout ratio of 15.13% and FCF payout ratio of 5.05% indicate a conservative approach, ensuring dividends are comfortably covered by earnings and cash flow.
💡 Cashflow & Capital Efficiency
Analyzing cash flow and capital efficiency is crucial for understanding a company's operational strength. Adequate cash flow ensures that the company can maintain dividends and invest in growth opportunities.
| Measure | 2025 | 2024 | 2023 |
|---|---|---|---|
| Free Cash Flow Yield | 8.76% | 9.51% | 8.38% |
| Earnings Yield | 3.64% | 5.04% | 3.62% |
| CAPEX to Operating Cash Flow | 19.85% | 24.51% | 31.45% |
| Stock-based Compensation to Revenue | 2.70% | 3.35% | 3.22% |
| Free Cash Flow / Operating Cash Flow Ratio | 80.15% | 75.49% | 68.55% |
The cash flow metrics indicate strong operational efficiency, with a stable Free Cash Flow yield supporting dividend payments.
📊 Balance Sheet & Leverage Analysis
A robust balance sheet is vital for financial stability, ensuring the company can withstand economic downturns. Leverage ratios help assess risk associated with debt levels.
| Measure | 2025 | 2024 | 2023 |
|---|---|---|---|
| Debt-to-Equity | 5.19 | 4.19 | 4.28 |
| Debt-to-Assets | 27.27% | 29.17% | 30.34% |
| Debt-to-Capital | 83.86% | 80.75% | 81.06% |
| Net Debt to EBITDA | -0.11 | 0.89 | 1.13 |
| Current Ratio | 0.73 | 0.72 | 0.78 |
| Quick Ratio | 0.73 | 0.72 | 0.78 |
| Financial Leverage | 19.04 | 14.38 | 14.11 |
While leverage is relatively high, the company's ability to generate sufficient earnings and cash flow lowers financial risk.
✅ Fundamental Strength & Profitability
Assessing fundamental strength through profitability and margins provides insights into the company's ability to generate sustainable returns.
| Measure | 2025 | 2024 | 2023 |
|---|---|---|---|
| Return on Equity | 100.78% | 79.25% | 51.96% |
| Return on Assets | 5.29% | 5.51% | 3.68% |
| Net Margin | 8.78% | 9.01% | 6.21% |
| EBIT Margin | 13.43% | 13.06% | 9.84% |
| EBITDA Margin | 19.45% | 19.18% | 16.12% |
| Gross Margin | 84.10% | 89.46% | 87.75% |
| R&D / Revenue | 8.67% | 9.60% | 10.58% |
Expedia shows robust profitability with strong ROE, though high R&D expenditure suggests ongoing investments in innovation.
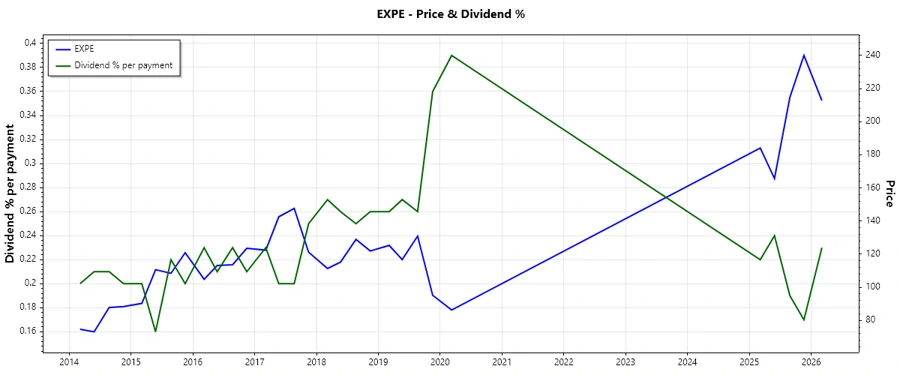
📉 Price Development
🔍 Dividend Scoring System
| Criteria | Score (1-5) | Score Bar |
|---|---|---|
| Dividend Yield | 2 | |
| Dividend Stability | 4 | |
| Dividend Growth | 3 | |
| Payout Ratio | 4 | |
| Financial Stability | 3 | |
| Dividend Continuity | 4 | |
| Cashflow Coverage | 4 | |
| Balance Sheet Quality | 3 |
Total Score: 27/40
🏁 Rating
Expedia Group, Inc. offers a stable dividend with moderate growth and robust profitability. While the dividend yield is modest, the company's strong fundamentals and cash flow support potential future dividend increases. Investors seeking growth should consider its potential, with a current focus on innovation through R&D.
Smart Data Insight
Master the Perfect Entry & Exit for this Stock
Don't leave your profits to chance. Historically, this stock follows specific seasonal patterns that institutional traders use to maximize returns.
- ✅ Identify the "Golden Buying Window"
- ✅ Avoid high-risk correction cycles
- ✅ Backtested data from the last 20+ years