December 16, 2025 a 03:31 pm

EXPE: Dividend Analysis - Expedia Group, Inc.
Expedia Group, Inc., a prominent player in the travel sector, presents a complex dividend profile marked by historical volatility. With no current dividends, the company appears to be focusing on reinvesting in its growth and operational expansion. This analysis will explore the financial health and potential of Expedia, offering insights into its dividend policy and financial stability.
Overview
Expedia Group, Inc., operating in the consumer discretionary sector, has displayed sporadic dividend activities reflective of its strategic priorities. The table below highlights the company's key dividend metrics.
| Metric | Value |
|---|---|
| Sector | Consumer Discretionary |
| Dividend Yield | 0.67 % |
| Current Dividend Per Share | 0 USD |
| Dividend History | 12 years |
| Last Cut or Suspension | 2020 |
Dividend History
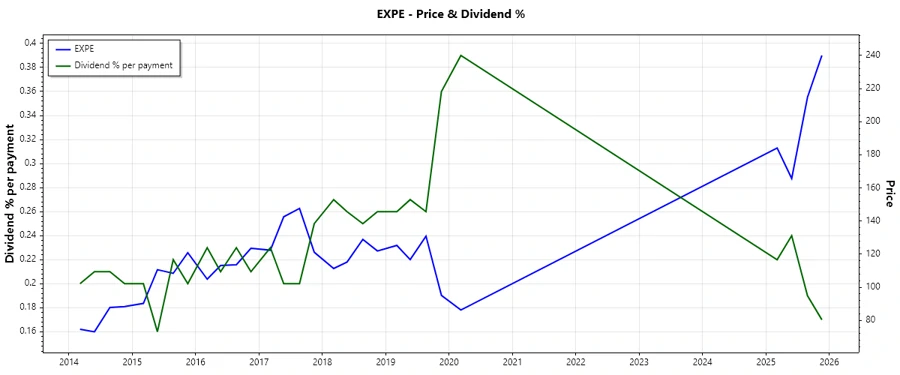
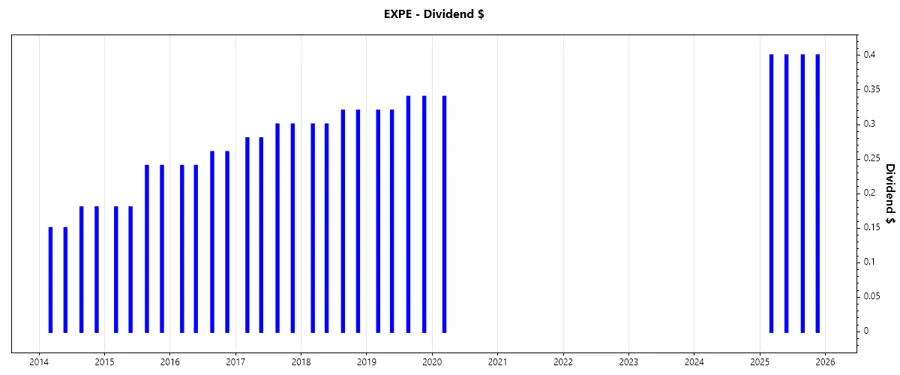
The historical dividend performance of Expedia reveals an interrupted pattern, emphasizing a period of no dividends post-2020. Understanding this company's strategy aids stakeholders to comprehend the firm's strategic financial decisions.
This historical perspective can help anticipate future trends and predict financial vitality.
| Year | Dividend Per Share (USD) |
|---|---|
| 2025 | 1.60 |
| 2020 | 0.34 |
| 2019 | 1.32 |
| 2018 | 1.24 |
| 2017 | 1.16 |
Dividend Growth
Analysis of dividend growth over recent periods portrays a stagnation with negative growth over the long term. This reflects the company's prioritization of capital redeployment over immediate shareholder returns.
| Time | Growth |
|---|---|
| 3 years | 0 % |
| 5 years | -23.76 % |
The average dividend growth is -23.76% over 5 years. This indicates a historical decline that aligns with broader market challenges posed earlier in the COVID-19 pandemic.
Payout Ratio
The payout ratio offers insights into the company's distribution policy and financial strategy, currently displaying no payout due to dividend suspension.
| Key Figure | Ratio |
|---|---|
| EPS-based | 0 % |
| Free Cash Flow-based | 0 % |
With a 0% payout in both EPS and FCF terms, it suggests an emphasis on strengthening core business operations and coping with external shocks, rather than distribution of profits.
Cashflow & Capital Efficiency
Understanding cash flow dynamics and capital efficiency offers a window into Expedia's ability to generate and utilize cash effectively.
| Metric | 2024 | 2023 | 2022 |
|---|---|---|---|
| Free Cash Flow Yield | 9.51% | 8.38% | 20.24% |
| Earnings Yield | 5.04% | 3.62% | 2.56% |
| CAPEX to Operating Cash Flow | 24.51% | 31.45% | 19.24% |
| Stock-based Compensation to Revenue | 3.35% | 3.22% | 3.21% |
| Free Cash Flow / Operating Cash Flow Ratio | 75.49% | 68.55% | 80.76% |
The analysis indicates stable cash flow generation with prudent capital utilization, reflecting positively on cash flow stability and investment returns.
Balance Sheet & Leverage Analysis
Balance sheet and leverage ratios provide a measure of the company's financial stability and ability to manage debt efficiently.
| Metric | 2024 | 2023 | 2022 |
|---|---|---|---|
| Debt-to-Equity | 4.19 | 4.28 | 2.87 |
| Debt-to-Assets | 29.17% | 30.34% | 30.39% |
| Debt-to-Capital | 80.75% | 81.06% | 74.16% |
| Net Debt to EBITDA | 0.89 | 1.13 | 1.53 |
| Current Ratio | 0.72 | 0.78 | 0.82 |
| Quick Ratio | 0.72 | 0.78 | 0.82 |
| Financial Leverage | 14.38 | 14.11 | 9.44 |
High leverage suggests potential vulnerability to economic variability, though the company manages a diverse portfolio that offers security against isolated negative occurrences.
Fundamental Strength & Profitability
Assessing fundamental performance offers insights into operational efficiency and long-term sustainability.
| Metric | 2024 | 2023 | 2022 |
|---|---|---|---|
| Return on Equity | 79.25% | 51.96% | 15.42% |
| Return on Assets | 5.51% | 3.68% | 1.63% |
| Net Margin | 9.01% | 6.21% | 3.02% |
| EBIT Margin | 13.06% | 9.84% | 6.99% |
| EBITDA Margin | 19.18% | 16.12% | 13.77% |
| Gross Margin | 89.46% | 87.75% | 85.80% |
| R&D to Revenue | 9.60% | 10.58% | 10.12% |
The company's ability to maintain high return metrics, especially in ROE and premium margins, is indicative of robust profit generation and efficient asset utilization.
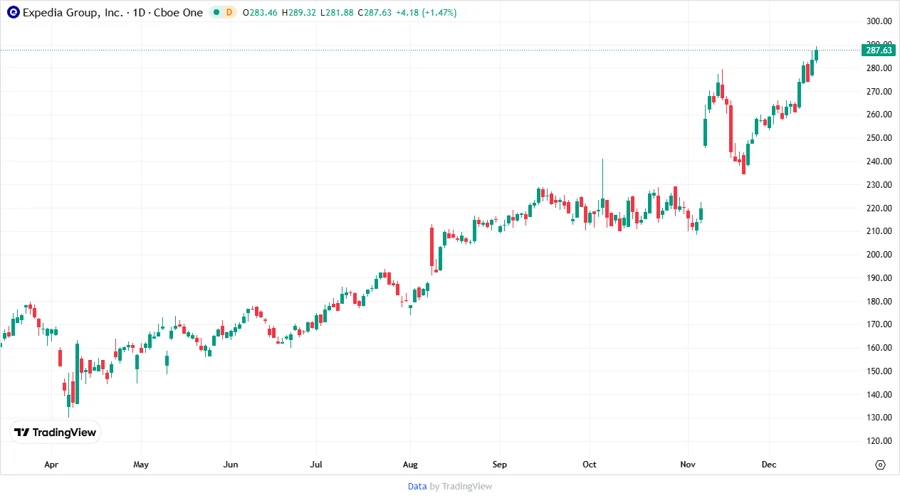
Price Development
Dividend Scoring System
Our comprehensive dividend scoring system evaluates various aspects of the company's dividend practices and financial stability.
| Category | Description | Score |
|---|---|---|
| Dividend Yield | Moderate yield offering limited immediate return | |
| Dividend Stability | Volatile history with periods of suspension | |
| Dividend Growth | Negative growth over a five-year span | |
| Payout Ratio | Currently none due to lack of dividend | |
| Financial Stability | Sustainable with high leverage ratios | |
| Dividend Continuity | Irregular payment schedule | |
| Cashflow Coverage | Strong cash generation capability | |
| Balance Sheet Quality | High leverage but balanced asset management |
Total Score: 19/40
Rating
Expedia Group displays a mixed dividend profile with sporadic payments and significant leverage challenges. However, its capacity for strong cash flow generation and efficient asset utilization makes it a candidate for future dividend recovery. Caution is advised for income-focused investors, but value seekers may consider it a potential for upside as financial metrics improve. Continued monitoring of debt levels and market conditions will be crucial as the company progresses with its recovery strategy.