September 11, 2025 a 02:47 am

EXPE: Dividend Analysis - Expedia Group, Inc.
Expedia Group, Inc. has an intriguing yet mixed dividend profile. The company's recent lack of dividend distribution indicates a cautious approach amidst financial challenges, exacerbated by the 2020 suspension. Its historical yield shows previous commitment to dividends, but current payout ratios essentially reflect a strategic hold on returns to shareholders. Investors should monitor potential future changes in the company's dividend policy in an attempt to stabilize returns.
📊 Overview
Despite recent challenges, Expedia Group shows resilience as a major player in the travel and leisure sector. The company’s dividend yield is modest, reflecting prudent fiscal management.
| Metric | Value |
|---|---|
| Sector | Travel & Leisure |
| Dividend yield | 0.56% |
| Current dividend per share | $0 |
| Dividend history | 12 years |
| Last cut or suspension | 2020 |
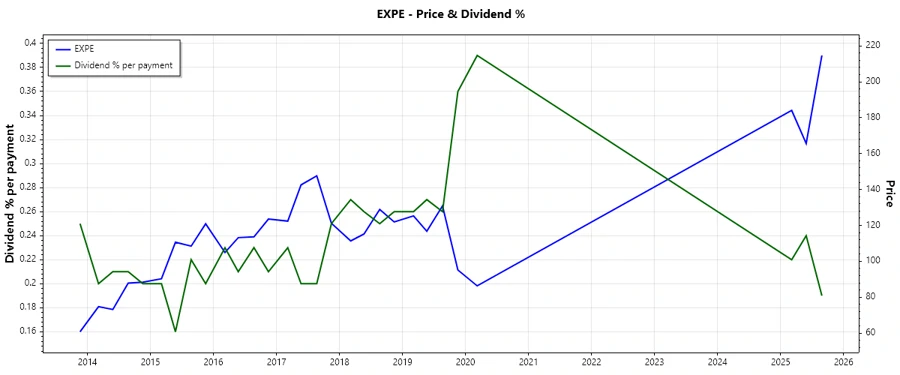
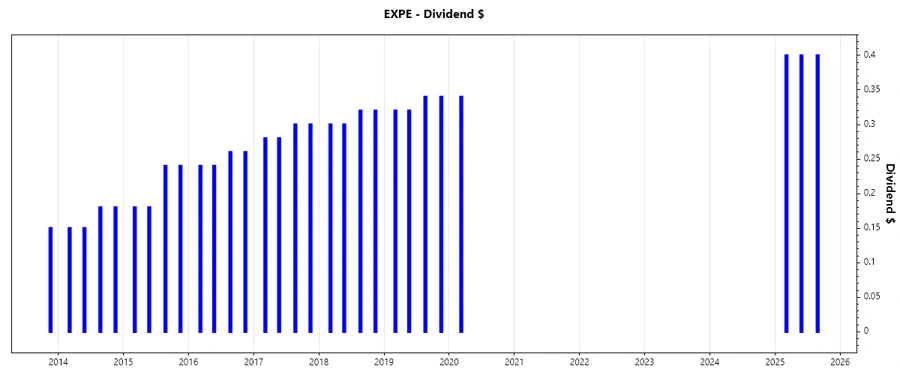
📈 Dividend History
Expedia Group’s dividend history showcases periods of robust payouts, evidencing past reliability in returning value to shareholders. The temporary suspension in 2020 highlights challenges faced by the travel industry.
| Year | Dividend per Share (USD) |
|---|---|
| 2025 | 1.20 |
| 2020 | 0.34 |
| 2019 | 1.32 |
| 2018 | 1.24 |
| 2017 | 1.16 |
📉 Dividend Growth
Expedia's historical dividend growth reveals insights into its strategic financial adjustments, primarily post-2020 impacts. A lack of growth in recent years underscores its priorities in capital allocation.
| Time | Growth |
|---|---|
| 3 years | 0% |
| 5 years | -0.24% |
The average dividend growth is -0.24% over 5 years. This shows negative growth, indicating challenges in maintaining dividend increases.
✅ Payout Ratio
The company's payout ratios are critical indicators of dividend sustainability. Currently reflecting no payout, this may suggest future stabilization efforts post-financial recovery.
| Key figure ratio | |
|---|---|
| EPS-based | 0% |
| Free cash flow-based | 0% |
This conservative approach suggests a prioritization of internal resource allocation and reinvestment during recovery phases.
💹 Cashflow & Capital Efficiency
The cash flow and capital efficiency metrics are crucial for dividend sustainability and reinvestment capabilities.
| Metric | 2024 | 2023 | 2022 |
|---|---|---|---|
| Free Cash Flow Yield | 9.51% | 8.38% | 20.24% |
| Earnings Yield | 5.04% | 3.62% | 2.56% |
| CAPEX to Operating Cash Flow | 24.51% | 31.45% | 19.24% |
| Stock-based Compensation to Revenue | 3.35% | 3.22% | 3.21% |
| Free Cash Flow / Operating Cash Flow Ratio | 75.49% | 68.55% | 80.76% |
Expedia shows a strong capability to generate cash, but high CAPEX may limit available free cash flow for dividend payouts.
📊 Balance Sheet & Leverage Analysis
An evaluation of leverage and liquidity ratios provides insight into financial health and risk exposure of the company.
| Metric | 2024 | 2023 | 2022 |
|---|---|---|---|
| Debt-to-Equity | 419.46% | 428.10% | 286.99% |
| Debt-to-Assets | 29.17% | 30.34% | 30.39% |
| Debt-to-Capital | 80.75% | 81.06% | 74.16% |
| Net Debt to EBITDA | 0.07 | 1.13 | 1.53 |
| Current Ratio | 0.75 | 0.78 | 0.82 |
| Quick Ratio | 0.72 | 0.78 | 0.82 |
| Financial Leverage | 14.38 | 14.11 | 9.44 |
The debt ratios indicate a high leverage environment, which could constrain financial flexibility despite current asset leverage improvements.
🚀 Fundamental Strength & Profitability
These metrics are vital for assessing the efficiency and profitability of the company, which in turn impact future dividend distribution potential.
| Metric | 2024 | 2023 | 2022 |
|---|---|---|---|
| Return on Equity | 79.25% | 51.96% | 15.42% |
| Return on Assets | 5.51% | 3.68% | 1.63% |
| Net Profit Margin | 9.01% | 6.21% | 3.02% |
| EBIT Margin | 13.06% | 9.84% | 6.99% |
| EBITDA Margin | 19.18% | 16.12% | 13.77% |
Expedia's recent profitability metrics reflect strategic focus on efficiency, setting a robust foundation for potential dividend reinstatement.
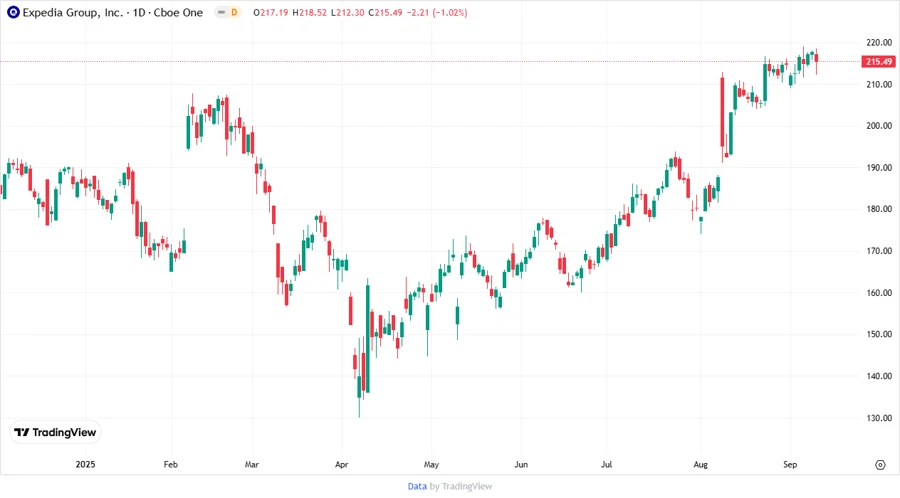
📈 Price Development
📊 Dividend Scoring System
| Criteria | Score | |
|---|---|---|
| Dividend yield | 1/5 | |
| Dividend Stability | 2/5 | |
| Dividend growth | 1/5 | |
| Payout ratio | 3/5 | |
| Financial stability | 3/5 | |
| Dividend continuity | 2/5 | |
| Cashflow Coverage | 3/5 | |
| Balance Sheet Quality | 2/5 |
Total Score: 17/40
🗣️ Rating
Despite the current lack of dividends, Expedia Group, Inc. shows potential for future growth and reinstatement of dividends, driven by efficiency enhancements and refined capital allocation strategies. Investors should keep a watchful eye on evolving financial health and strategic direction.
Smart Data Insight
Master the Perfect Entry & Exit for this Stock
Don't leave your profits to chance. Historically, this stock follows specific seasonal patterns that institutional traders use to maximize returns.
- ✅ Identify the "Golden Buying Window"
- ✅ Avoid high-risk correction cycles
- ✅ Backtested data from the last 20+ years