September 18, 2025 a 08:15 am
EXPD: Trend and Support & Resistance Analysis - Expeditors International of Washington, Inc.
Expeditors International of Washington, Inc., a global leader in logistics services, has been experiencing a mixture of market movements. Given the recent trends in the stock market data, understanding the technical indicators becomes crucial for investors. The recent data suggest a nuanced position for EXPD stocks, making technical analysis a vital tool for informed decision-making.
Trend Analysis
The following table summarizes the trend analysis based on the last seven days of trading data for EXPD:
| Date | Close Price | Trend |
|---|---|---|
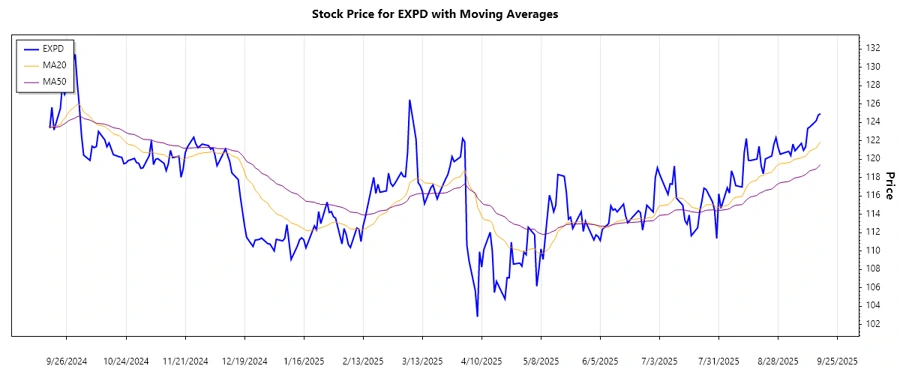
| 2025-09-17 | 124.95 | ▲ |
| 2025-09-16 | 124.80 | ▲ |
| 2025-09-15 | 124.18 | ▲ |
| 2025-09-12 | 123.51 | ▲ |
| 2025-09-11 | 123.35 | ▲ |
| 2025-09-10 | 121.34 | ▲ |
| 2025-09-09 | 120.96 | ▲ |
The EMA calculations indicate an upward trend, as EMA20 is greater than EMA50. This suggests a bullish sentiment for the stock in the short term.
Support and Resistance
Based on recent stock data, the following support and resistance levels have been identified:
| Zone Type | Price From | Price To |
|---|---|---|
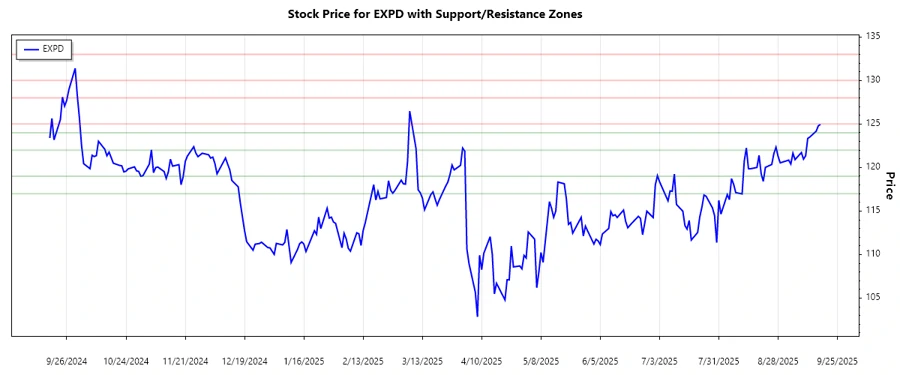
| Support | 117.00 | 119.00 |
| Support | 122.00 | 124.00 |
| Resistance | 125.00 | 128.00 |
| Resistance | 130.00 | 133.00 |
The current stock price of 124.95 lies in the resistive zone from 125.00 to 128.00, indicating a potential barrier for upward movement in the immediate future.
Conclusion
Expeditors International's stock is currently exhibiting an upward trend with a short-term bullish outlook as EMA readings support this movement. While the stock is climbing, it currently approaches a resistance zone which might pose a short-term challenge. Investors should consider both the bullish indicators and the potential obstacles presented by resistance levels. Careful monitoring is advised to assess whether the market can sustain this upward momentum or faces a correction. Understanding these technical factors can aid in informed decision-making regarding potential market entry or exit points.
Smart Data Insight
Master the Perfect Entry & Exit for this Stock
Don't leave your profits to chance. Historically, this stock follows specific seasonal patterns that institutional traders use to maximize returns.
- ✅ Identify the "Golden Buying Window"
- ✅ Avoid high-risk correction cycles
- ✅ Backtested data from the last 20+ years